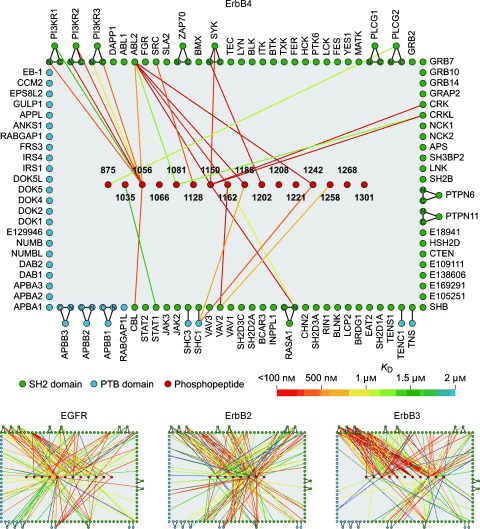
Figure 1.

Quantitative interaction networks of tyrosine kinases associated with the ErbB family of receptors as determined by using protein microarrays displaying 96 SH2 and 37 PTB domains. SH2/PTB‐domain microarrays were probed with fluorescently labeled phosphopeptides representing tyrosine phosphorylation sites on the ErbB kinases. The microarray readout of peptide binding was based on fluorescence. The interaction networks were constructed from the quantitative interaction data obtained.9 Reprinted from reference 9 with permission from Elsevier.
