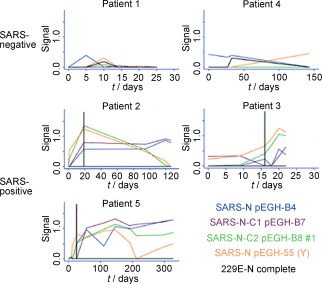
Figure 4.

Time‐course analysis of the serum reactivity of SARS‐specific antibodies in five Canadian individuals. Top: Results for two individuals with non‐SARS respiratory disease. Bottom: Results for three SARS patients. The relative levels of antibodies against four of the SARS‐N‐protein constructs and the HCoV‐229E N protein were monitored at different times by protein‐microarray analysis. The vertical line indicates the time at which the individuals were diagnosed as SARS‐positive by biochemical assays. Reproduced with permission from reference 31 (copyright (2006) National Academy of Sciences, USA).
