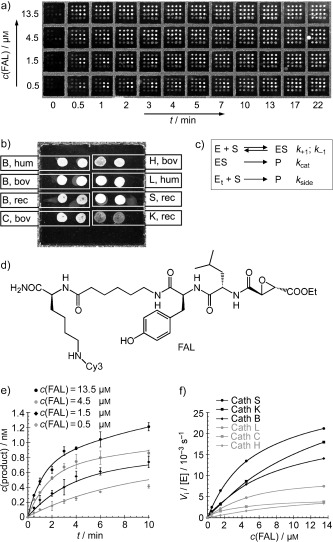
Figure 6.

a) Fluorescence‐scanner image of a protease microarray treated with the protease inhibitor FAL at different concentrations in a time‐dependent manner. b) Fluorescent image of a subarray with cathepsin proteases spotted in duplicate (hum: human, bov: bovine, rec: recombinant; letters denote the subtype of cathepsin). c) Best‐fit Michaelis–Menten kinetics derived from the Michaelis–Menten equation for the protease microarray. Et=Etotal. d) Structure of the fluorescent affinity label (FAL). e) Data obtained from the microarray in (a) for cathepsin L at different concentrations of FAL and time points. f) Initial velocities obtained from the microarray in (a) for all proteases at different concentrations of FAL.38 Reprinted with permission from reference 38 (copyright (2005) Macmillan Publishers Ltd: Nature Biotechnology).
