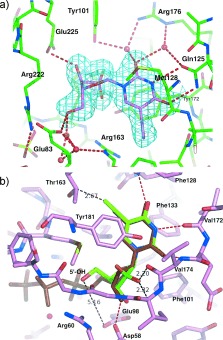
Figure 2.

a) Cocrystal structure of dF‐EdU (violet) bound in the active site of HSV1‐TK (green, PDB entry code 4OQL). The electron density map (2F obs−F calc) of dF‐EdU with a resolution of 2.1 Å is contoured at 1 σ and shown in cyan. Water molecules are depicted as red spheres and hydrogen bonds as dashed red lines. b) Superposition of dF‐EdU (green) onto dTTP (brown) within the active site of hTK (pink, PDB entry code 1W4R).22
