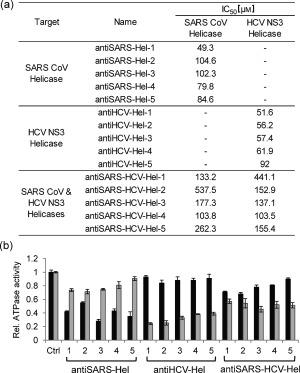
Figure 4.

Quantitative evaluation of the 15 helicase inhibitors identified and their inhibition of the ATPase activities of the helicases. a) IC50 values of the 15 small molecules screened (chemical formulas are shown in the Supporting Information). b) ATPase activity of the helicases, measured in the presence of the inhibitors. Black bars=SARS helicase; Gray bars=HCV helicase.
