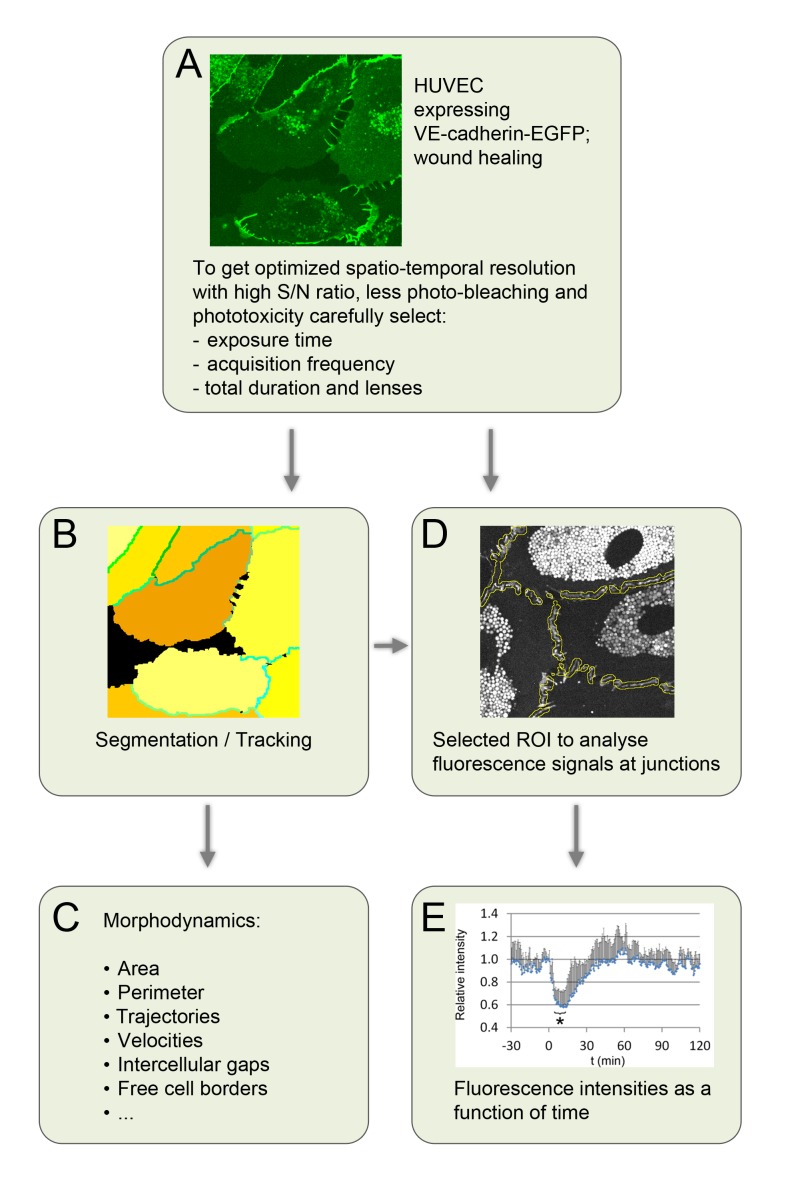
Figure 3. Scheme illustrating the work-flow for quantitative analyis of endothelial junctions and free cell border dynamics from image segmentations.
Image taken of HUVEC cultures that express VE-cadherin-EGFP after optimization of microscopic settings (A). The cell border extractor was applied and segments both cell junctions and individual cells, and subsequently assigns each cell and each cell junction a unique color-coded identification number (ID), (B). Many parameters can be extracted from the segmentations (C). The identified position of the color-coded intercellular junctions (B, different green colored lines) can be used to generate regions of interest (ROI) (D, yellow outlines) that in turn provide input parameters to quantify various parameters, for example fluorescence intensities as demonstrated for the EGFP-p20 intensity at endothelial junctions upon thrombin applications (E) (reproduced from our previous work23 (Seebach et al, Histochemistry and Cell Biology 2015, 144: 517-532) with permission).

