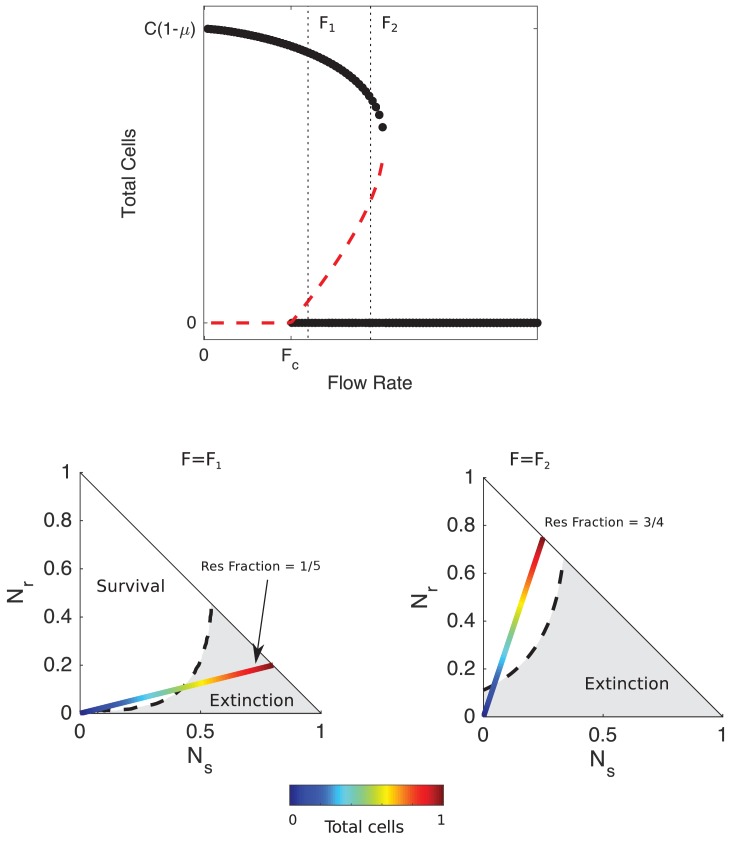
Figure 2. Mathematical model predicts bistability due to opposing density-dependent effects of sensitive and resistant cells on drug inhibition.
Top: bifurcation diagram showing stable (filled circles) and unstable (red dashed curves) fixed points for different values of drug influx () and the total number of cells (). is the critical value of drug influx above which the zero solution (extinction) becomes stable; μ is the rate at which cells and drugs are removed from the system (and is measure in units of , the maximum per capita growth rate of cells in drug-free media, and is the factor increase in drug MIC of the resistant strain relative to the wild-type strain. Vertical black dashed lines correspond to (small drug influx, just above threshold) and (large drug influx). Bottom panels: regions of survival (white) and extinction (grey) in the space of sensitive () and resistant () cells for flow rate (left) and (right). Dashed lines show separatrix, the contour separating survival from extinction. Multicolor lines represent constant resistant fractions (1/5, left; 3/4, right) at different total population sizes (ranging from 0 (blue) to a maximum density of 1 (red)). Cell numbers are measured in units of carrying capacity. Specific numerical plots were calculated with , , , , , , , , and .


