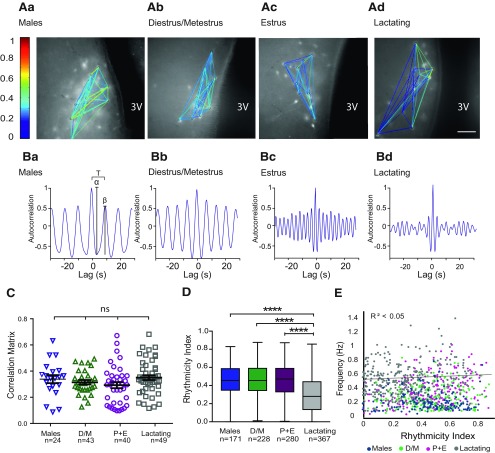
Figure 3.
Rhythmicity, but not functional connectivity, of TIDA neurons is affected in lactating dams. A, Representative network maps of the functional connectivity in DAT-GCaMP3 neurons in the dmArc of adult male (Aa), female in diestrus/metestrus (D/M; Ab), female in estrus (from the proestrus+estrus group; P + E; Ac), and lactating dam (Ad). Color coding represents the degree of correlation between neuron pairs. Ba–d, Representative autocorrelation from one of the neurons from maps shown in A for the respective groups. Ba, Autocorrelogram illustrates the oscillation period (T), the amplitude of the first trough (α), and the amplitude of the second peak (β); the RI was defined as RI = β/α. C, Scatter plots represent mean values of the correlation matrix between groups and SEM. There are no significant differences (p = 0.31-0.87). One-way ANOVA with Tukey's multiple comparison used as post hoc test. n indicates the number of network maps per hemisphere. D, Box plots represent the interquartile ranges (square) and median (line). Values with whiskers indicate minimum and maximum values of the RI. The RI of the lactating group was significantly lower than the RI of the other groups. ****p< 0.001 (Kruskal–Wallis with Dunn's multiple comparison as post hoc test). n indicates the number of cells. All other comparisons between groups are nonsignificant. Scale bar: (in Ad) Aa–d, 50 µm. 3V, Third ventricle. E, The correlation between the Ca2+ oscillation frequency and the RI is low, suggesting that the speed of the oscillation is independent of the rhythmicity.

