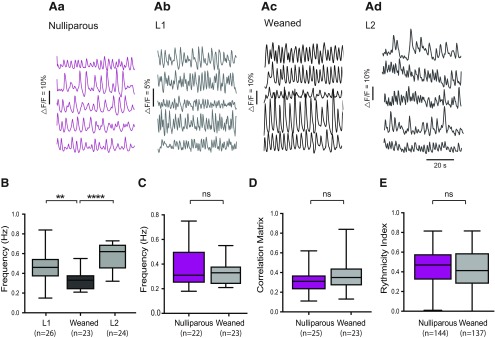
Figure 4.
Lactation-associated network changes reverse on weaning of pups. A, Representative concomitant traces of Ca2+ fluctuations in DAT-GCaMP3 neurons in the dmArc from the same slice in nulliparous female in estrus (Aa), primipara lactating (L1) dam (Ab), dam in estrus, 3 weeks after weaning (Ac), and lactating dam following a second pregnancy (L2; Ad). B, Box plot represents the interquartile ranges (square) and median (line). Values with whiskers indicate minimum and maximum values of the oscillation frequency. Note significantly lower frequency in weaned dams compared with L1 and L2. **p < 0.01 (one-way ANOVA with Tukey' multiple comparison as post hoc test). ****p < 0.0001C, There is no significant difference between the average frequency of the Ca2+ oscillations between the estrus (nulliparous) group and the weaned females during estrus (unpaired Student's t test, p = 0.06). D, There is no significant difference between the correlation matrix mean between the estrus (nulliparous) group and the weaned females during estrus (unpaired Student's t test, p = 0.14). n indicates the number of network maps per hemisphere. E, There is no significant difference between the rhythmicity index between the estrus (nulliparous) group and the weaned females during estrus (Mann–Whitney, p = 0.33). n indicates the number of cells. Aa, Ab, Same traces as Figures 2Ac, d, respectively. The number of animals is as follows: L1, n = 5; L2, n = 5; nulliparous, n = 7; weaned, n = 4.

