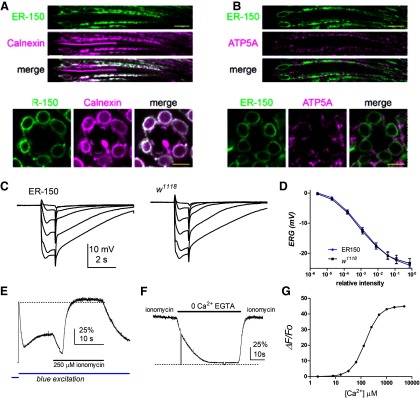
Figure 2.
Expression and calibration of ER-150. A, Optical sections of ommatidia from newly-eclosed flies expressing ER-150 colabeled with anti-GFP (to recognize ER-150; green) and anti-Calnexin (independent ER marker; magenta) show extensive co-localization (note that ER-150, under control of the ninaE promoter, is expressed only in R1-6 photoreceptor cells, but Calnexin is also expressed in R7 and R8 cells). Top, Longitudinal view. Scale bar, 10 µm. Below, Transverse view. Scale bar, 5 µm. B, Similar optical sections colabeled with anti-GFP (ER-150; green) and a mitochondrial marker anti-ATP5a (magenta) indicate little or no co-localization. C, Electroretinogram (ERG) responses to 1 s flashes of increasing intensity in ER-150 files and wild-type control (w1118). D, response intensity (V/log I) functions from maintained negative component of the ERG (average of final 100 ms of responses before the off transient; mean ± SEM, n = 6 flies). E, Fluorescence measured from a dissociated wild-type ommatidium expressing ER-150. Following the rapid decay (store depletion) and partial recovery induced by the onset of the blue excitation light (Fig. 3B), the ommatidium was perfused with bath solution containing 250 μm ionomycin, 10 mm CaCl2 (25 mm TES, pH 7.25). Fluorescence first decayed briefly before rapidly increasing slightly beyond the initial dark adapted F0 (dotted line). F, In an ommatidium already exposed to 250 μm ionomycin, subsequent perfusion with 0 Ca2+ (1 mm EGTA) solution rapidly reduced fluorescence to near zero (zero level, dotted line, indicated by brief breaks in the blue excitation), recovering rapidly on reperfusion with Ca2+/ionomycin containing solution. G, Theoretical calibration curve for ER-150 assuming a dynamic range of 45 Kd 150 μm and Hill coefficient of 1.6 (de Juan-Sanz et al., 2017).

