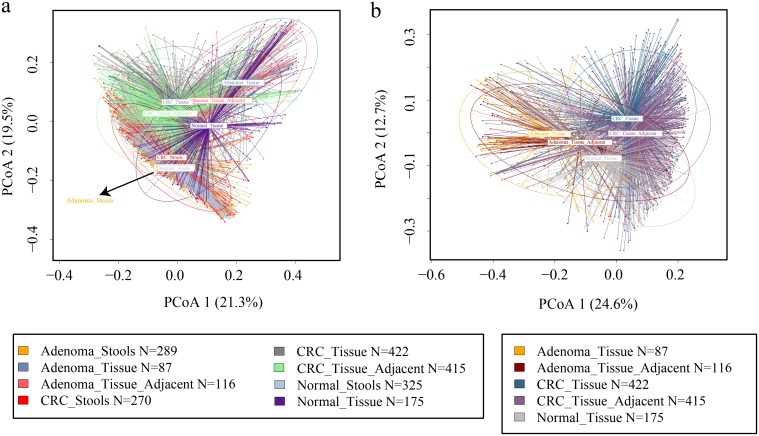
FIG 1.
Principal-coordinate analysis (PCoA) in viewing groups of samples. (a) The beta diversity based on the Bray-Curtis metric was used to perform PCoAs. The first two principal coordinates were graphed to visualize the sample group relationships. (b) A similar procedure was applied to CRA and CRC tissue-associated samples to demonstrate particular sample relationships. Each ellipse in different colors represents 95% of the inertia of the corresponding group. Group tags that are not legible due to overlap are specified using dark arrows.

