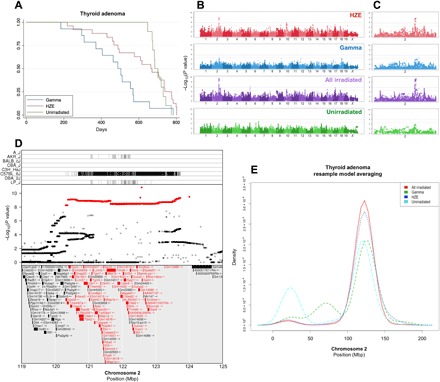
Fig. 2. Genome-wide association mapping identifies a susceptibility locus for thyroid adenoma shared by exposure groups.

Thyroid follicular adenoma Kaplan-Meier survival estimate (A) along with genome-wide association plots for thyroid adenoma in HZE ion–irradiated, γ-ray–irradiated, HZE ion– and γ-ray–irradiated, and unirradiated mice (B) and an expanded plot for chromosome 2 (C), which contains the most significant association locus; gray lines indicate 95% (upper line) and 90% confidence (lower line) for −log10(P values). Genome-wide association results reveal significant results in HZE ion– and γ-ray–irradiated mice that are further bolstered by combining the groups. The top panel of (D) shows strains that contribute the reference allele for the SNPs highlighted in red in the middle panel, indicated by vertical lines (D); the C57BL/6J strain contributes an allele that differs significantly from the other seven strains. The middle panel shows the −log10(P value) of each SNP in the interval (D); the most significant SNPs are highlighted in red, and the bottom panel lists genes within the QTL interval. Genes that contain splice site, missense, or stop-related SNPs are colored red (D). Resample model averaging was performed within chromosome 2 to compare the distribution of peak −log10(P values) for each exposure group (E); there is broad overlap for HZE- and γ-ray–irradiated mice, and grouping all irradiated mice together further narrows the distribution of peak −log10(P values). Mbp, megabase pair.
