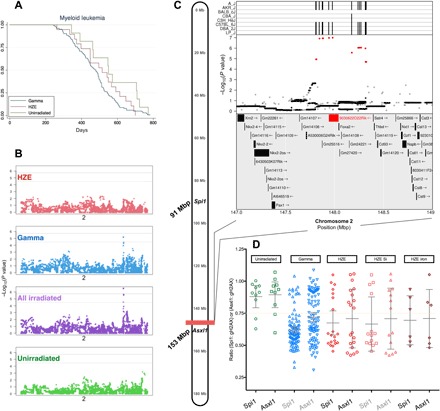
Fig. 3. A radiation-associated chromosomal deletion contains a susceptibility locus for myeloid leukemia.

(A) Kaplan-Meier plots for myeloid leukemia demonstrate similar median survival estimates for myeloid leukemia between groups. (B) Genome-wide association procedures identify a narrow QTL on chromosome 2; two gray lines indicate 95% (upper line) and 90% confidence (lower line) for −log10(P values). Expanded mapping results are depicted in (C) along with contributing strains for the reference allele. The A/J, AKR/J, C57BL/6J, DBA/2J, and LP/J strains contribute alleles that differ from the other strains, indicated by vertical lines in the top panel (C). The middle panel shows the −log10(P value) of each SNP in the interval. The most significant SNPs are highlighted in red. The bottom panel shows the genes in the QTL interval. Genes that contain splice site, missense, or stop-related SNPs are indicated in red. Copy number results for Spi1 and Asxl1 in splenic samples from mice diagnosed with myeloid leukemia are plotted by exposure group (D).
