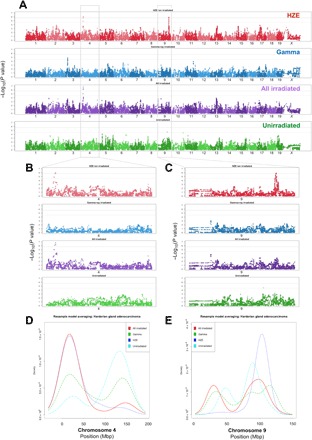
Fig. 4. Genome-wide associations for Harderian gland adenocarcinomas identify QTL common to both irradiation groups and specific to HZE exposures.

Genome-wide association plots for Harderian gland adenocarcinoma (A) for HZE ion–irradiated, γ-ray–irradiated, HZE ion– and γ-ray–irradiated, and unirradiated mice; two gray lines indicate 95% (upper line) and 90% confidence (lower line) for −log10(P values). Chromosome 4, which is expanded in (B), reveals a significant QTL associated with HZE ion irradiation, which is further increased significantly when grouping all irradiated mice (HZE ion and γ-ray irradiated) together, which indicated that the genetic variants in this location are important for Harderian gland adenocarcinoma following exposures to either HZE ion or γ-ray irradiation. In contrast, chromosome 9, which is expanded in (C), reveals a significant QTL associated only with HZE ion irradiation; this locus is absent when grouping all irradiated mice (HZE ion and γ-ray irradiated) together, which suggests that the allele(s) present in this region may only play a role for HZE ion–induced tumors. Resample model averaging was performed within chromosomes containing significant QTL. There is significant spatial overlap identified on chromosome 4 for peak −log10(P value) associations in the HZE ion–exposed population, the γ-ray–irradiated population, and the HZE ion– and γ-ray–irradiated population that demonstrates the most consistent identification of the QTL region (D). In contrast, although nearly all identified peak −log10(P values) were identified in the chromosome 9 QTL interval for HZE ion irradiated mice, the peak −log10(P values) for other exposure groups are widely distributed along the chromosome (E).
