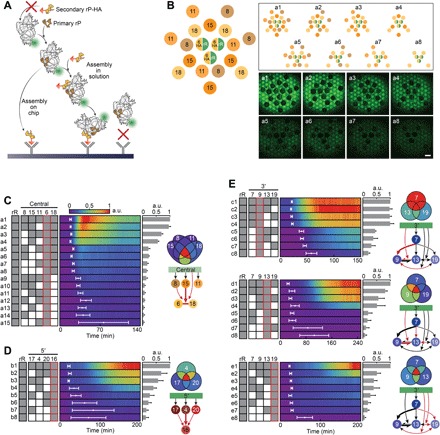
Fig. 3. Binding dependencies of E. coli secondary r-proteins.

(A) Scheme: Two modes of r-RNA binding to r-protein–HA on the surface, dependent on prebinding of other r-proteins to the r-RNA, in the absence of assembly factors. (B) Brush layouts (a1 to a8) of central domain analysis (S6-HA) and the corresponding fluorescent images at t = 45 min. Scale bar, 100 μm. (C to E) Signal dynamics color maps of brush combinations, central (a1 to a15), 5′ (b1 to b8), and 3′ (c1 to c8, d1 to d8, e1 to e8) domains. White time intervals represent t0. Gene combinations are depicted as gray and white boxes, indicating the presence or absence of an r-protein gene, respectively. Red frame indicates the r-protein–HA. Averaged fmax values are presented as bars at the end of each color map and as a Venn diagram according to the color scale. Error bars are SD of three repeats. Partial assembly maps depict in red the dependencies deduced from the corresponding study. Large arrows represent strong dependencies.
