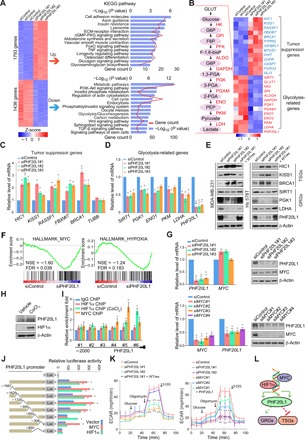
Fig. 1. PHF20L1 regulates TSGs and GRGs expression and participates in MYC and hypoxia signaling.

(A) Heatmap representation of differentially expressed genes (fold change, >1.5; P < 0.001) in control (siControl) and PHF20L1 KD (siPHF20L1-1, siPHF20L1-2, and siPHF20L1-3) MDA-MB-231 cells. Red, up-regulated genes; blue, down-regulated genes. The right panel shows the results of the KEGG pathway analysis of differentially expressed genes. Data were analyzed using KOBAS 3.0 software (B) Heatmap of known TSGs and GRGs identified by RNA-seq. (C and D) qRT-PCR analysis of selected TSGs and GRGs in PHF20L1 KD (siPHF20L1) MDA-MB-231 cells. TUBB (β-tublin) served as an irrelevant control gene. The mRNA levels were normalized to those of ATCB (β-actin). (E) Western blotting analysis of selected TSGs and GRGs in control, PHF20L1 KD, and PHF20L1 KD MDA-MB-231 or Hs 578T cells stably expressing short hairpin RNA (shRNA)–resistant PHF20L1 (WTres). β-Actin served as loading control. (F) Gene set enrichment analysis (GSEA) plot of MYC signal pathway (left) and hypoxia signal pathway (right). FDR, false discovery rate; NES, normalized enrichment score. (G) MYC KD significantly down-regulates the expression of PHF20L1. The expression of MYC or PHF20L1 was measured by qRT-PCR and Western blotting in MDA-MB-231 cells transfected with siRNAs as indicated. (H) Western blotting analysis of the expression of PHF20L1 and hypoxia-inducible factor 1α (HIF1α) in MDA-MB-231 cells treated with CoCl2. (I) Primer pairs including #1 to #6 were synthesized to cover the promoter region of PHF20L1 and quantitative chromatin immunoprecipitation (qChIP)–based promoter walk was performed using normal or CoCl2-treated MDA-MB-231 cells. (J) Luciferase activity of PHF20L1 promoter reporters in human embryonic kidney (HEK) 293T cells transfected with vector, MYC, or HIF1α. (K) MDA-MB-231 cells were transfected with indicated siRNAs or infected with lentiviruses as indicated. ECAR (extracellular acidification rate) was then determined separately. (L) A proposed model underlying the role of the MYC/HIF1a-PHF20L1 axis in regulating the expression of TSGs and GRGs. All error bars represent means ± SD. Two-tailed unpaired t test, *P < 0.05 and **P < 0.01 (C, D, G, I, J, and K).
