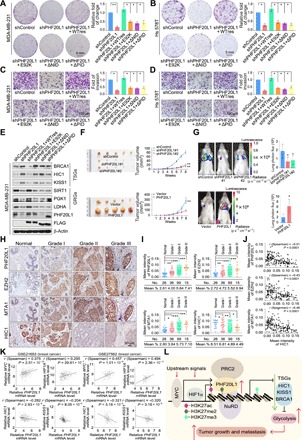
Fig. 5. PHF20L1 acts in concert with its associated corepressor complexes to promote breast carcinogenesis.

(A) Colony formation assays were performed in control, PHF20L1 KD, and PHF20L1 KD MDA-MB-231 cells stably expressing shRNA-resistant PHF20L1 (represented as WTres), PHF20L1E98K, PHF20L1ΔNID, or PHF20L1ΔPID. (B) Colony formation assays were performed in control, PHF20L1 KD, and PHF20L1 KD Hs 578T cells stably expressing shRNA-resistant PHF20L1, PHF20L1E98K, PHF20L1ΔNID, or PHF20L1ΔPID. (C) Transwell invasion assays were performed in cells as in (A). IgG, immunoglobulin G. (D) Transwell invasion assays were performed in cells as in (B). Data shown are means ± SD. Two-tailed unpaired t test, *P < 0.05 and **P < 0.01 (A to D). (E) Western blotting analysis of the TSGs and GRGs in MDA-MB-231 cells as in (A). (F) MDA-MB-231 cells infected with lentiviruses carrying shControl, shPHF20L1, or stably expressing vector PHF20L1 were inoculated orthotopically into the abdominal mammary fat pads of 6-week-old female BALB/c nude mice (n = 5), and tumor volumes were measured weekly. Data shown are means ± SD. **P < 0.01 at the final day. (G) MDA-MB-231 cells stably expressing firefly luciferase were infected as in (F) then injected intravenously through the tail veins of 6-week-old female severe combined immunodeficient (SCID) mice (n = 6). Lung metastasis was monitored using bioluminescent imaging up to 7 weeks after injection. Representative in vivo bioluminescent images are shown. Data shown are means ± SD. Two-tailed unpaired t test, *P < 0.05. (H) Immunohistochemical (IHC) staining of PHF20L1, EZH2, MTA1, and HIC1 in breast carcinoma samples (histological grades I, II, and III) paired with adjacent normal mammary tissues. Representative images (original magnification, ×200) are shown. (I) Scores of the stained sections from (H) were determined by Image-Pro Plus software and are presented with box plots. Boxes represent the 25th and 75th percentiles; lines represent the median, and whiskers show the minimum and maximum points. *P < 0.05, **P < 0.01, and ***P < 0.001 by one-way analysis of variance (ANOVA). (J) Immunohistochemistry results from (H) were used to analyze the correlation coefficient and P values as indicated. (K) Analysis of public datasets (GSE21653 and GSE27562) from breast cancer for the correlation of MYC, HIF1A, HIC1, KISS1, and PHF20L1. (L) The proposed model for the MYC/HIF1α-(PHF20L1-PRC2-NuRD)-HIC1/KISS1 axis in breast carcinogenesis. Photo credit: Yongqiang Hou, Tianjin Medical University.
