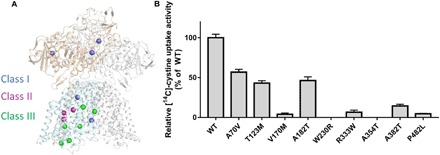
Fig. 4. Cystinuria-related mutations mapping in the b0,+AT-rBAT complex and putative working model.

(A) Cystinuria-related mutations mapping in the complex, which can be classified into classes I, II, and III that are colored in blue, purple, and green, respectively. (B) The transport activity of disease-related mutations.
