
Fig. 2. Hypoxia-induced cellular membrane depolarization is decreased in AOX-expressing PASMC.
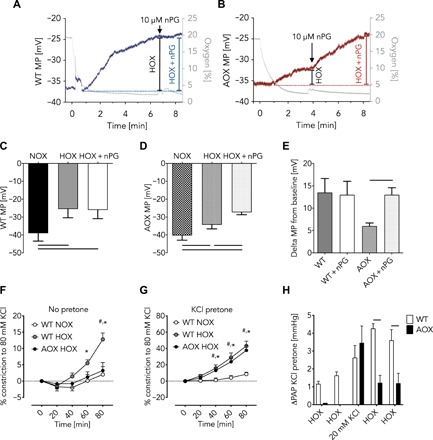
(A and B) Representative traces of patch clamp measurements to determine cellular membrane potential (MP) during acute HOX (1% O2) in mouse WT (A) and AOX (B) PASMC. Gray traces depict oxygen concentration in %; blue (WT) and red (AOX) traces indicate MP in millivolts. Addition of AOX inhibitor nPG as indicated. Cellular MP in mouse WT (C) and AOX (D) PASMC during normoxia (NOX) and acute HOX or acute HOX plus nPG. (E) Change of cellular MP compared with NOX in the absence and presence of nPG as indicated. Data of (C) to (E) shown as means ± SEM of n = 6 experiments. Horizontal bars indicate significant difference with P < 0.05 analyzed by repeated-measures one-way ANOVA and Tukey’s multiple comparisons test. (F) Vasoconstriction of isolated pulmonary arteries during superfusion with hypoxic (1% O2) or normoxic KCl-free buffer shown as % of response to 80 mM KCl. Data are shown as means ± SEM of n = 8 experiments. *P < 0.05 WT NOX versus WT HOX; #P < 0.05 WT HOX versus AOX HOX analyzed by two-way ANOVA and Tukey’s multiple comparisons test. (G) Vasoconstriction as in (F) but in the presence of ~20 mM KCl. Data are shown as means ± SEM of n = 8 experiments. *P < 0.05 WT NOX versus WT HOX; #P < 0.05 WT NOX versus AOX HOX analyzed by two-way ANOVA and Tukey’s multiple comparisons test. (H) PAP response of isolated WT and AOX lungs during HOX (10% O2) ventilation before and after infusion of 20 mM KCl. Data are shown as means ± SEM of n = 3 experiments. Horizontal bars indicated significant difference with P < 0.05 analyzed by two-way ANOVA and Sidak’s multiple comparisons test.