
Fig. 2. Enhanced Pol II clustering upon serum stimulation.
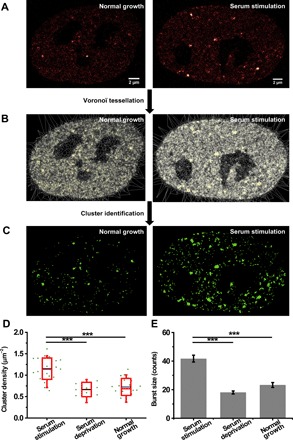
(A) Representative live-cell PALM images of Pol II under normal growth condition (n = 35 cells) and under serum stimulation condition (n = 39 cells). (B) Voronoϊ tessellation of the images in (A) by SR-Tesseler. (C) Images of Pol II clusters identified by SR-Tesseler. (D) Cluster density under serum stimulation (n = 23 cells), serum deprivation (n = 10 cells), and normal growth conditions (n = 20 cells). Each green dot is the mean for all Pol II clusters from a single nucleus. The blue line is the mean for the whole population of nuclei under the indicated condition. The red box shows the SD around the mean. The red line within the red box is the median. The whiskers show 5 and 95%. (E) Burst size under serum stimulation (n = 829 bursts of 104 clusters from 23 cells), serum deprivation (n = 174 bursts of 61 clusters from 10 cells), and normal growth conditions (n = 306 bursts of 111 clusters from 20 cells). Data are shown as means ± SEM. Statistical significance was determined by one-way analysis of variance (ANOVA) with Tukey-Kramer test. ***P < 0.001.