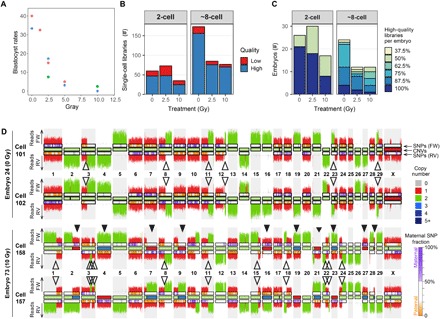
Fig. 1. Characteristics of blastocysts and single-cell libraries of analyzed bovine embryos.

(A) Percentage of blastocysts that develop from fertilization with sperm treated with different doses of γ-radiation. Forty to 268 maturated oocytes per treatment group were fertilized with sperm radiated with 0, 1.25, 2.5, 5, 10, and 25 Gy. The number of blastocysts was counted at day 8 after fertilization. The results were obtained from three independent fertilization experiments indicated by dot color. (B) Number of successfully sequenced single-cell libraries per developmental stage. High-quality libraries have more than 100,000 nonduplicate reads with a mapping quality of more than 10 and 10 or less filtered chromosomal or segmental abnormalities. Strand-seq libraries additionally required the typical strand inheritance patterns. Sequencing results for low-quality libraries with more than 10,000 reads are also included in the karyograms, because they can be informative for identifying sister cells, but they are excluded for further quantitative analyses. (C) Percentage of sequenced high-quality single-cell libraries per embryo. (D) Strand-seq–derived copy number profiles for the Watson strand and the Crick strand plotted above and below chromosome ideograms, respectively. Top: Two sister cells from a diploid control embryo. Bottom: Two sister cells from a mosaic embryo produced with 10 Gy–treated sperm. Closed arrowheads highlight mitotic errors. Mitotic errors are reciprocal, where a gain in one cell is lost in its sister cell. Open arrowheads designate SCE events. SCEs have occurred at positions where the template strands switch from Watson-Crick to Watson-Watson or Crick-Crick. SCEs are fully mirrored between sister cells. FW, forward/Crick strand; RV, reverse/Watson strand. The inside of the chromosome ideograms is color-coded to indicate copy number (see legend for the copy number states). The ideograms for the Watson and the Crick strands are color-coded to indicate the contribution of maternal SNVs (see legend for details).
