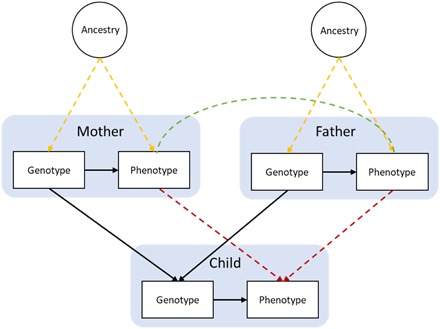
Fig. 1. Causal models of structures underlying genetic associations.

Population stratification due to ancestral differences (yellow lines), dynastic effects (red lines), and assortative mating (green line). Arrows represent direction of effect; nondirected lines represent simultaneous assortment. Note: Assortative mating by phenotype will lead to genotypic correlation (62).
