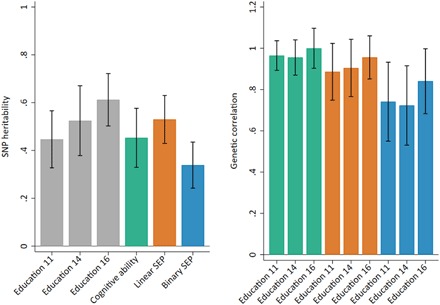
Fig. 2. SNP heritability and genetic correlations between phenotypes.

(A) Gray bars represent educational achievement measured as exam point scores at ages 11, 14, and 16; green bar represents cognitive ability measured at age 8; orange bar represents a linear measure of SEP measured as highest parental score on the Cambridge Social Stratification Score; blue bar represents a binary measure of SEP measured as “advantaged” for the highest two categories of Social Class based on Occupation and “disadvantaged” for the lower four categories. (B) Green bars represent genetic correlations between educational achievement at ages 11, 14, and 16 with cognitive ability measured at age 8; orange bars represent genetic correlations between educational achievement at ages 11, 14, and 16 with linear SEP; blue bars represent genetic correlations between educational achievement at ages 11, 14, and 16 with binary SEP. All analyses include adjustment for the first 20 principal components of population stratification. Parameter estimates in tables S1 and S2.
