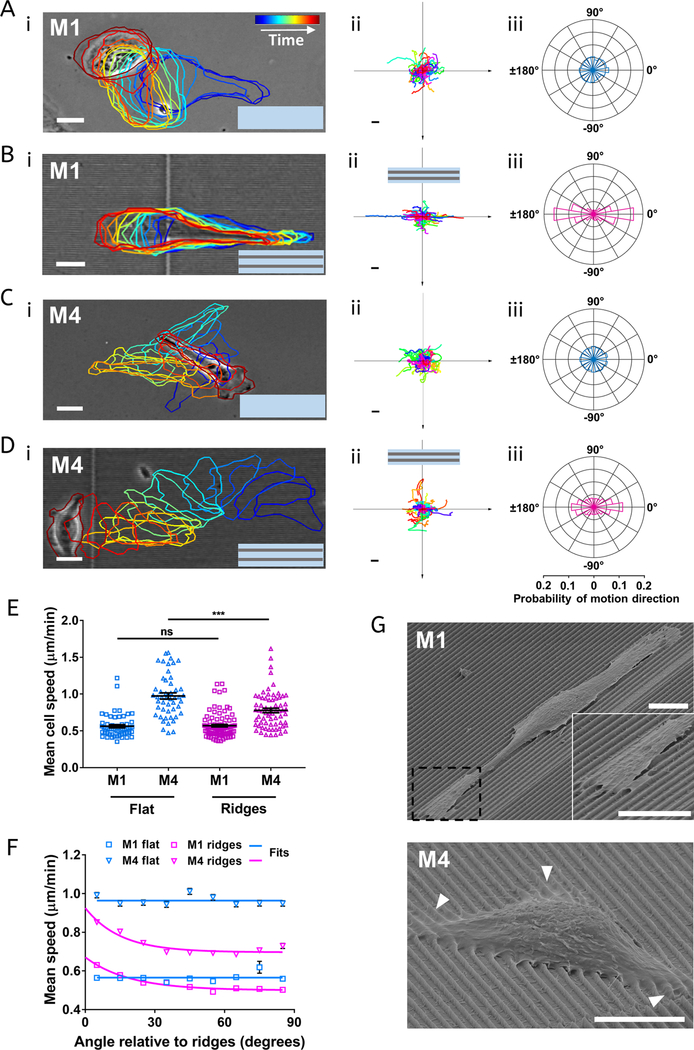
Figure 2.
Nanoridges provide bidirectional guidance for benign and metastatic breast cancer cells. (A−Di) Bright-field images of M1 or M4 cells on a flat surface (A,C) and on nanoridges (B,D). The colored outlines depict how the cell morphology changes over time, which increases from blue to red. The scale bar is 10 μm. (A−Dii) Centroid motion tracks of M1 and M4 cells, respectively, on a flat surface (A,C) and on nanoridges (B,D); n = 56 tracks (Aii); 94 tracks (Bii); 49 tracks (Cii); 68 tracks (Dii). The scale bar is 60 μm. (A−Diii) Probability distributions of cell motion directionality. The scale at the bottom corresponds to the horizontal axis in each rose plot. (E) Average cell speed of M1 and M4 cells on flat surfaces and on nanoridges. The middle solid line in each column is the mean value, and the bar is standard error of the mean; ***p < 0.001 (unpaired t test). (F) Average instantaneous speed of M1 and M4 cells relative to the orientation of ridges (0° along ridges, 90° perpendicular to ridges). Squares and triangles are experimental results, and solid lines are the fits to the experimental results. Blue solid line was fitted to a horizontal line, and the pink solid line was fitted to a one-phase decay model. (G) Representative SEM images of M1 (top) and M4 (bottom) cells on nanoridges. The magnified image highlights the anchoring of M1 cell lamellipodia on top of the nanoridges. White arrows indicate sites where M4 cell lamellipodia curve over the nanoridges. The scale bar is 10 μm.

