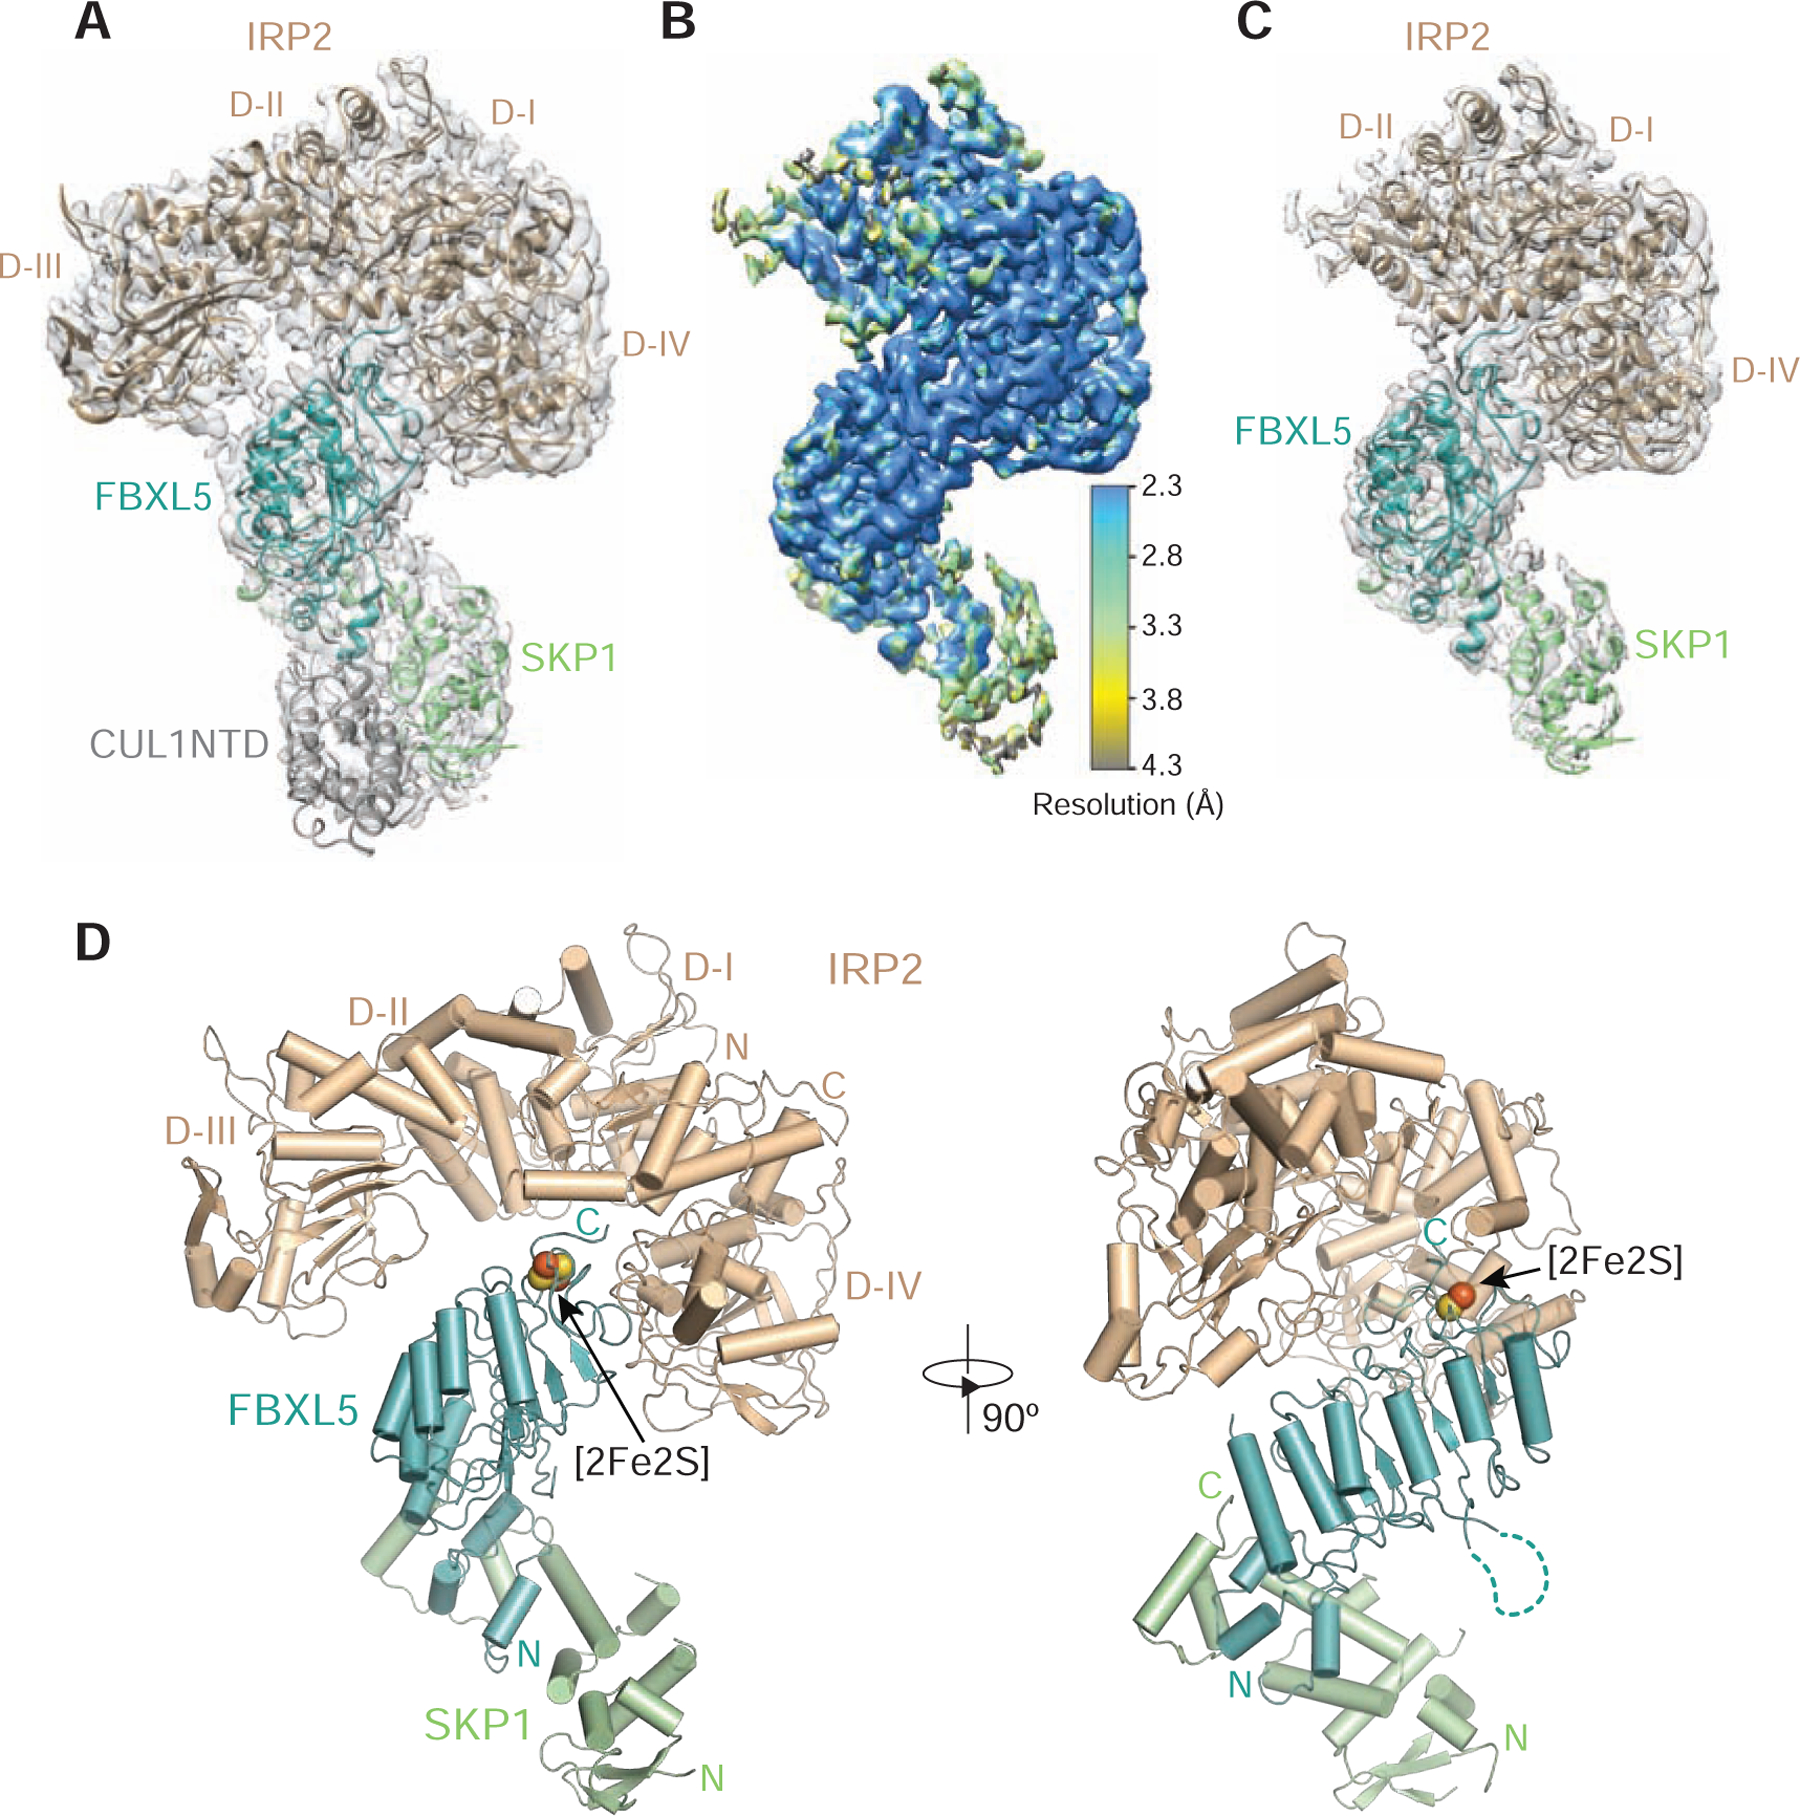
Figure 2. Cryo-EM structure of the IRP2-FBXL5-SKP1 complex.

(A) A 3.9 Å electron microscopy map fit with structural models of IRP2 (wheat), FBXL5 (teal), SKP1 (green) and CUL1NTD (gray).
(B) 3D reconstruction of the IRP2-FBXL5-SKP1-CUL1NTD complex at an overall resolution of 3.0 Å is colored according to local resolution estimated by ResMap.
(C) The structure of the IRP2-FBXL5-SKP1 complex modeled with the 3.0 Å density map shown in (B).
(D) Two orthogonal views of the IRP2-FBXL5-SKP1 complex shown in ribbon diagram with the same color scheme as shown in (A). The [2Fe2S] cluster is shown in spheres. The N and C termini of different proteins are labeled N and C in corresponding colors. The dashed line in teal indicates the deleted internal loop of FBXL5.
See also Figures S1, S3, S4, and S5.
