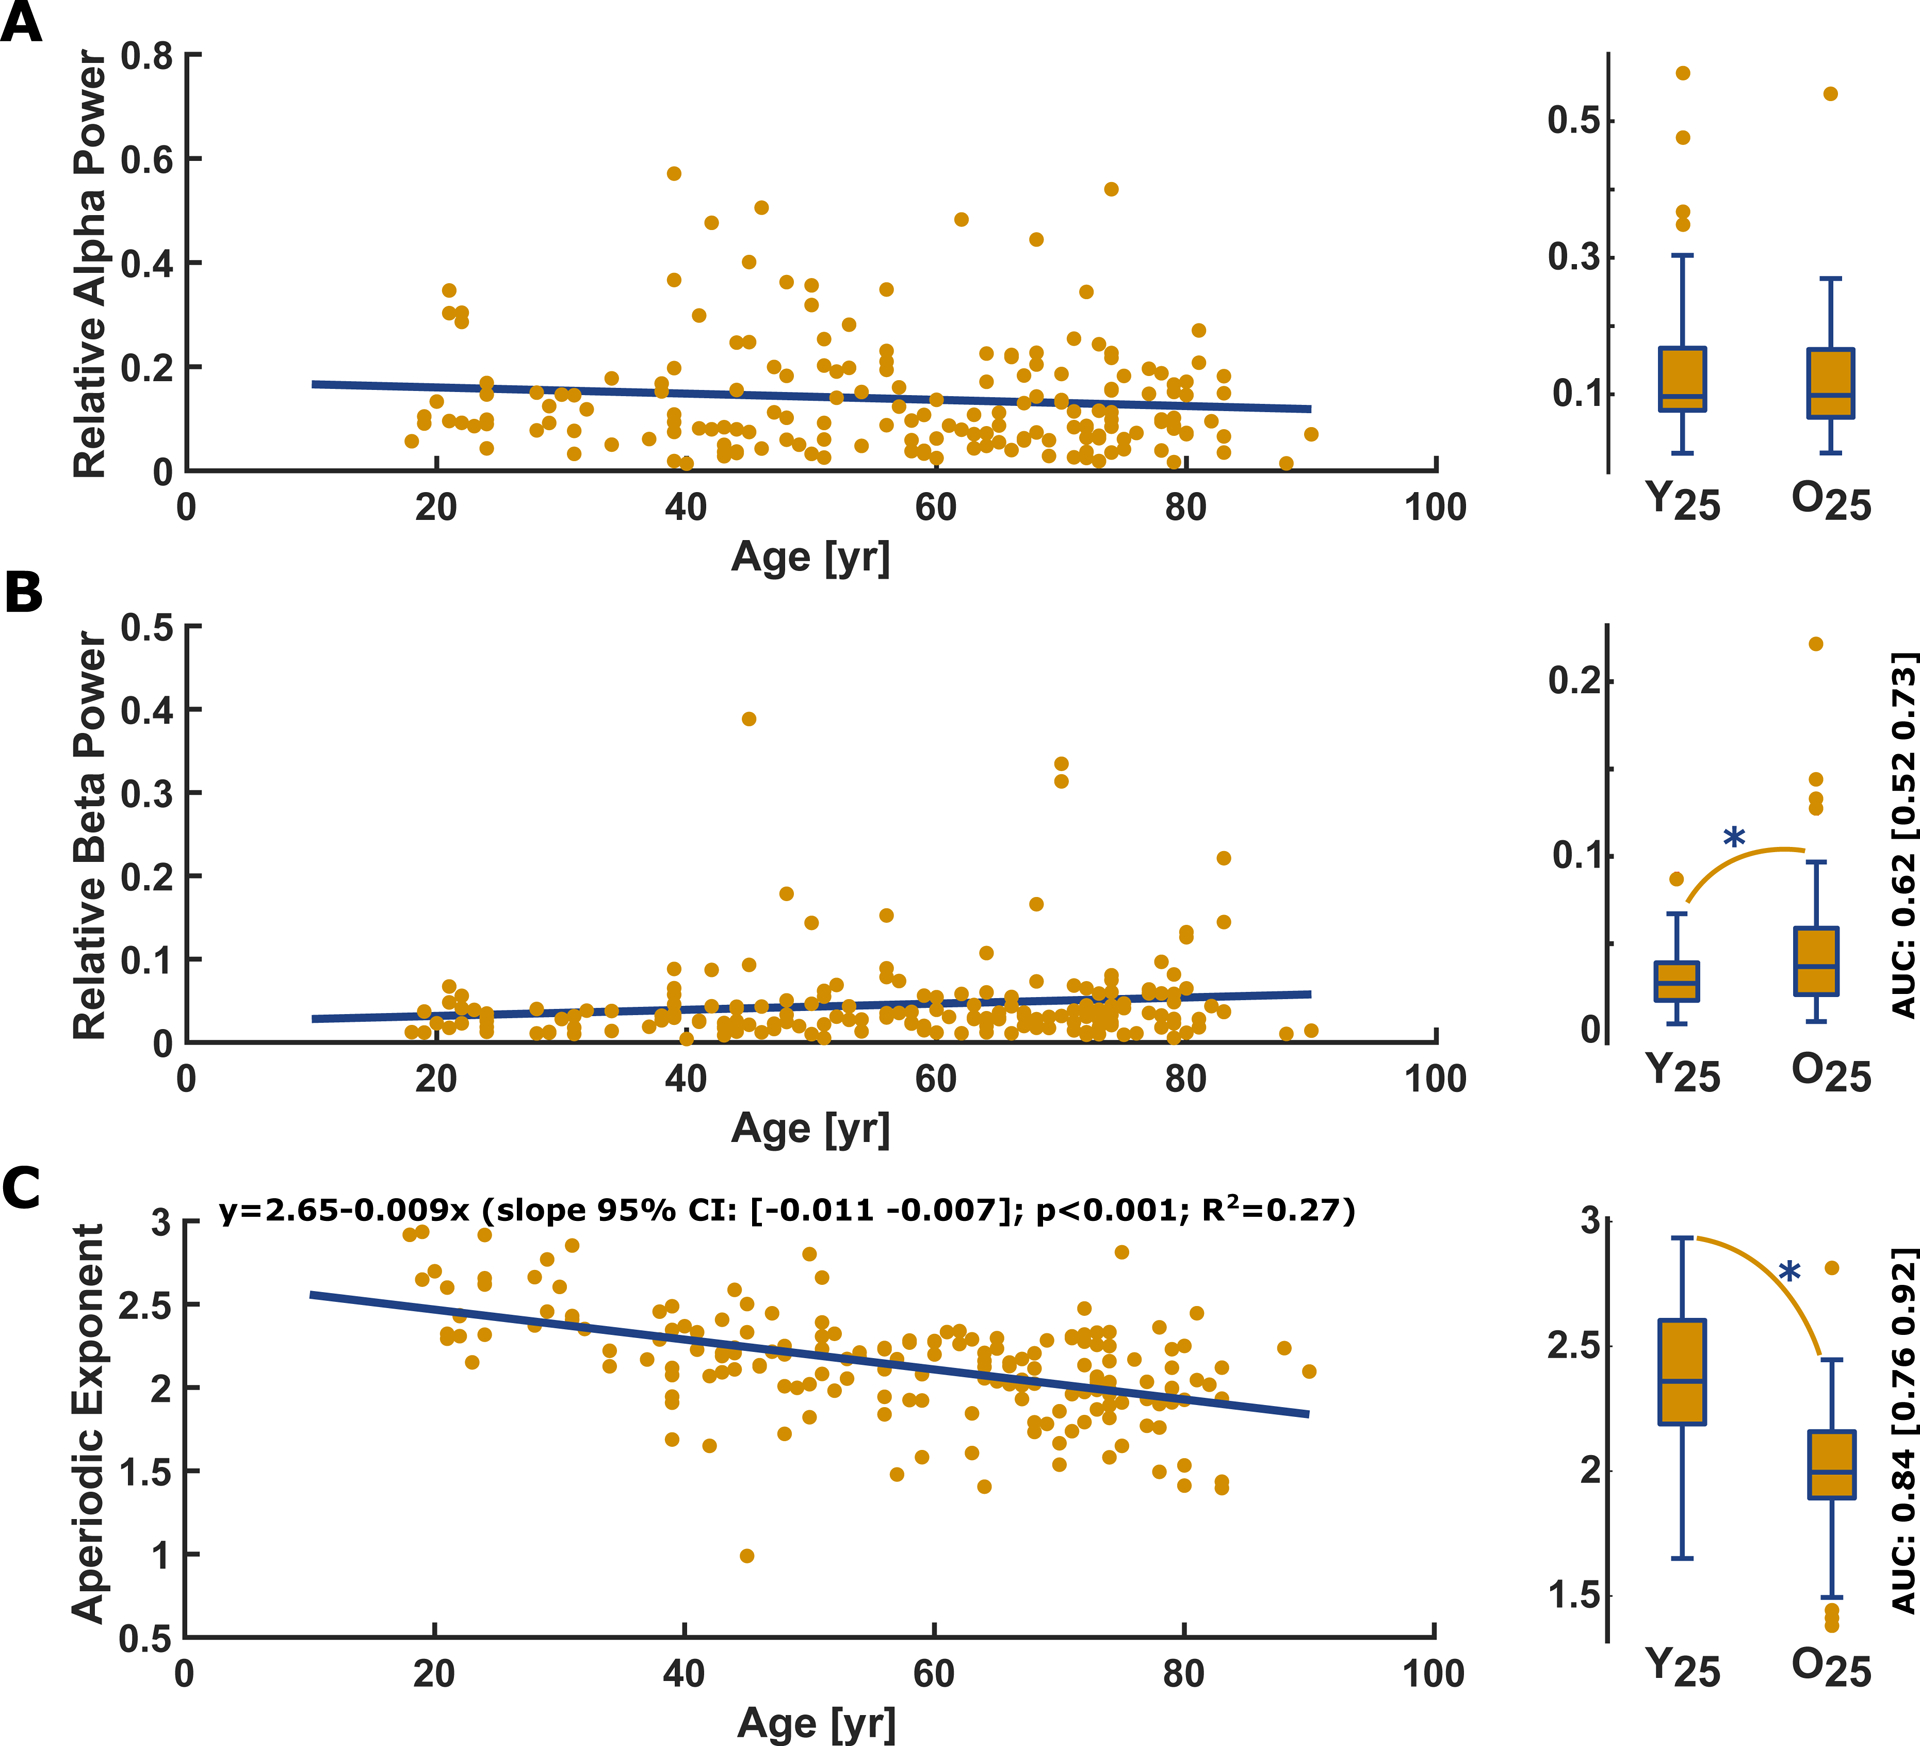
Figure 3: Linear regression and box plots of the youngest vs. the oldest quartile for (A) the relative (normalized) EEG alpha power, (B) the relative EEG beta power, and (C) the slope of the aperiodic 1/f component with corresponding box plots.

A) Relative power in the alpha-band EEG did not significantly (p= 0.176, t-statistic: −1.36) change with age. There was no significant difference (p= 0.693, AUC= 0.52 [0.42 0.63]) in relative alpha power between Y25 (0.10 [0.08 0.17]) and O25 (0.10 [0.07 0.17]).
B) Relative EEG beta power did not significantly (p=0.077, t-statistic: 1.78) change with age, but there was a significant difference (p= 0.041) in relative beta power between Y25 (0.03 [0.02 0.04]) and O25 (0.04 [0.02 0.06]). The AUC=0.62 [0.52 0.73] as effect site indicated a “poor” effect
C) The slope of the aperiodic 1/f component derived by the fitting oscillations & one over f algorithm significantly decreased with age (p<0.001, t-statistic: −8.14). The box plot indicates a significant flatter (p<0.001) slope in O25 patients (median [1st 3rd quartile]: 2.00 [1.89 2.16]) compared to the Y25 (2.36 [2.19 2.60]). The AUC=0.84 [0.76 0.92] as effect site indicated a “good” effect.
In the regression plots, the yellow dots present the single patients and the blue line the linear fit. Y25: youngest 25% O25: oldest 25%; yr: year
