
Figure 4: Permutation entropy (m=3, τ=1): Linear regression and box plots of the youngest vs. the oldest quartile for the (A) 0.5–30 Hz range, (B) the alpha range, (C) and the EEG beta range.
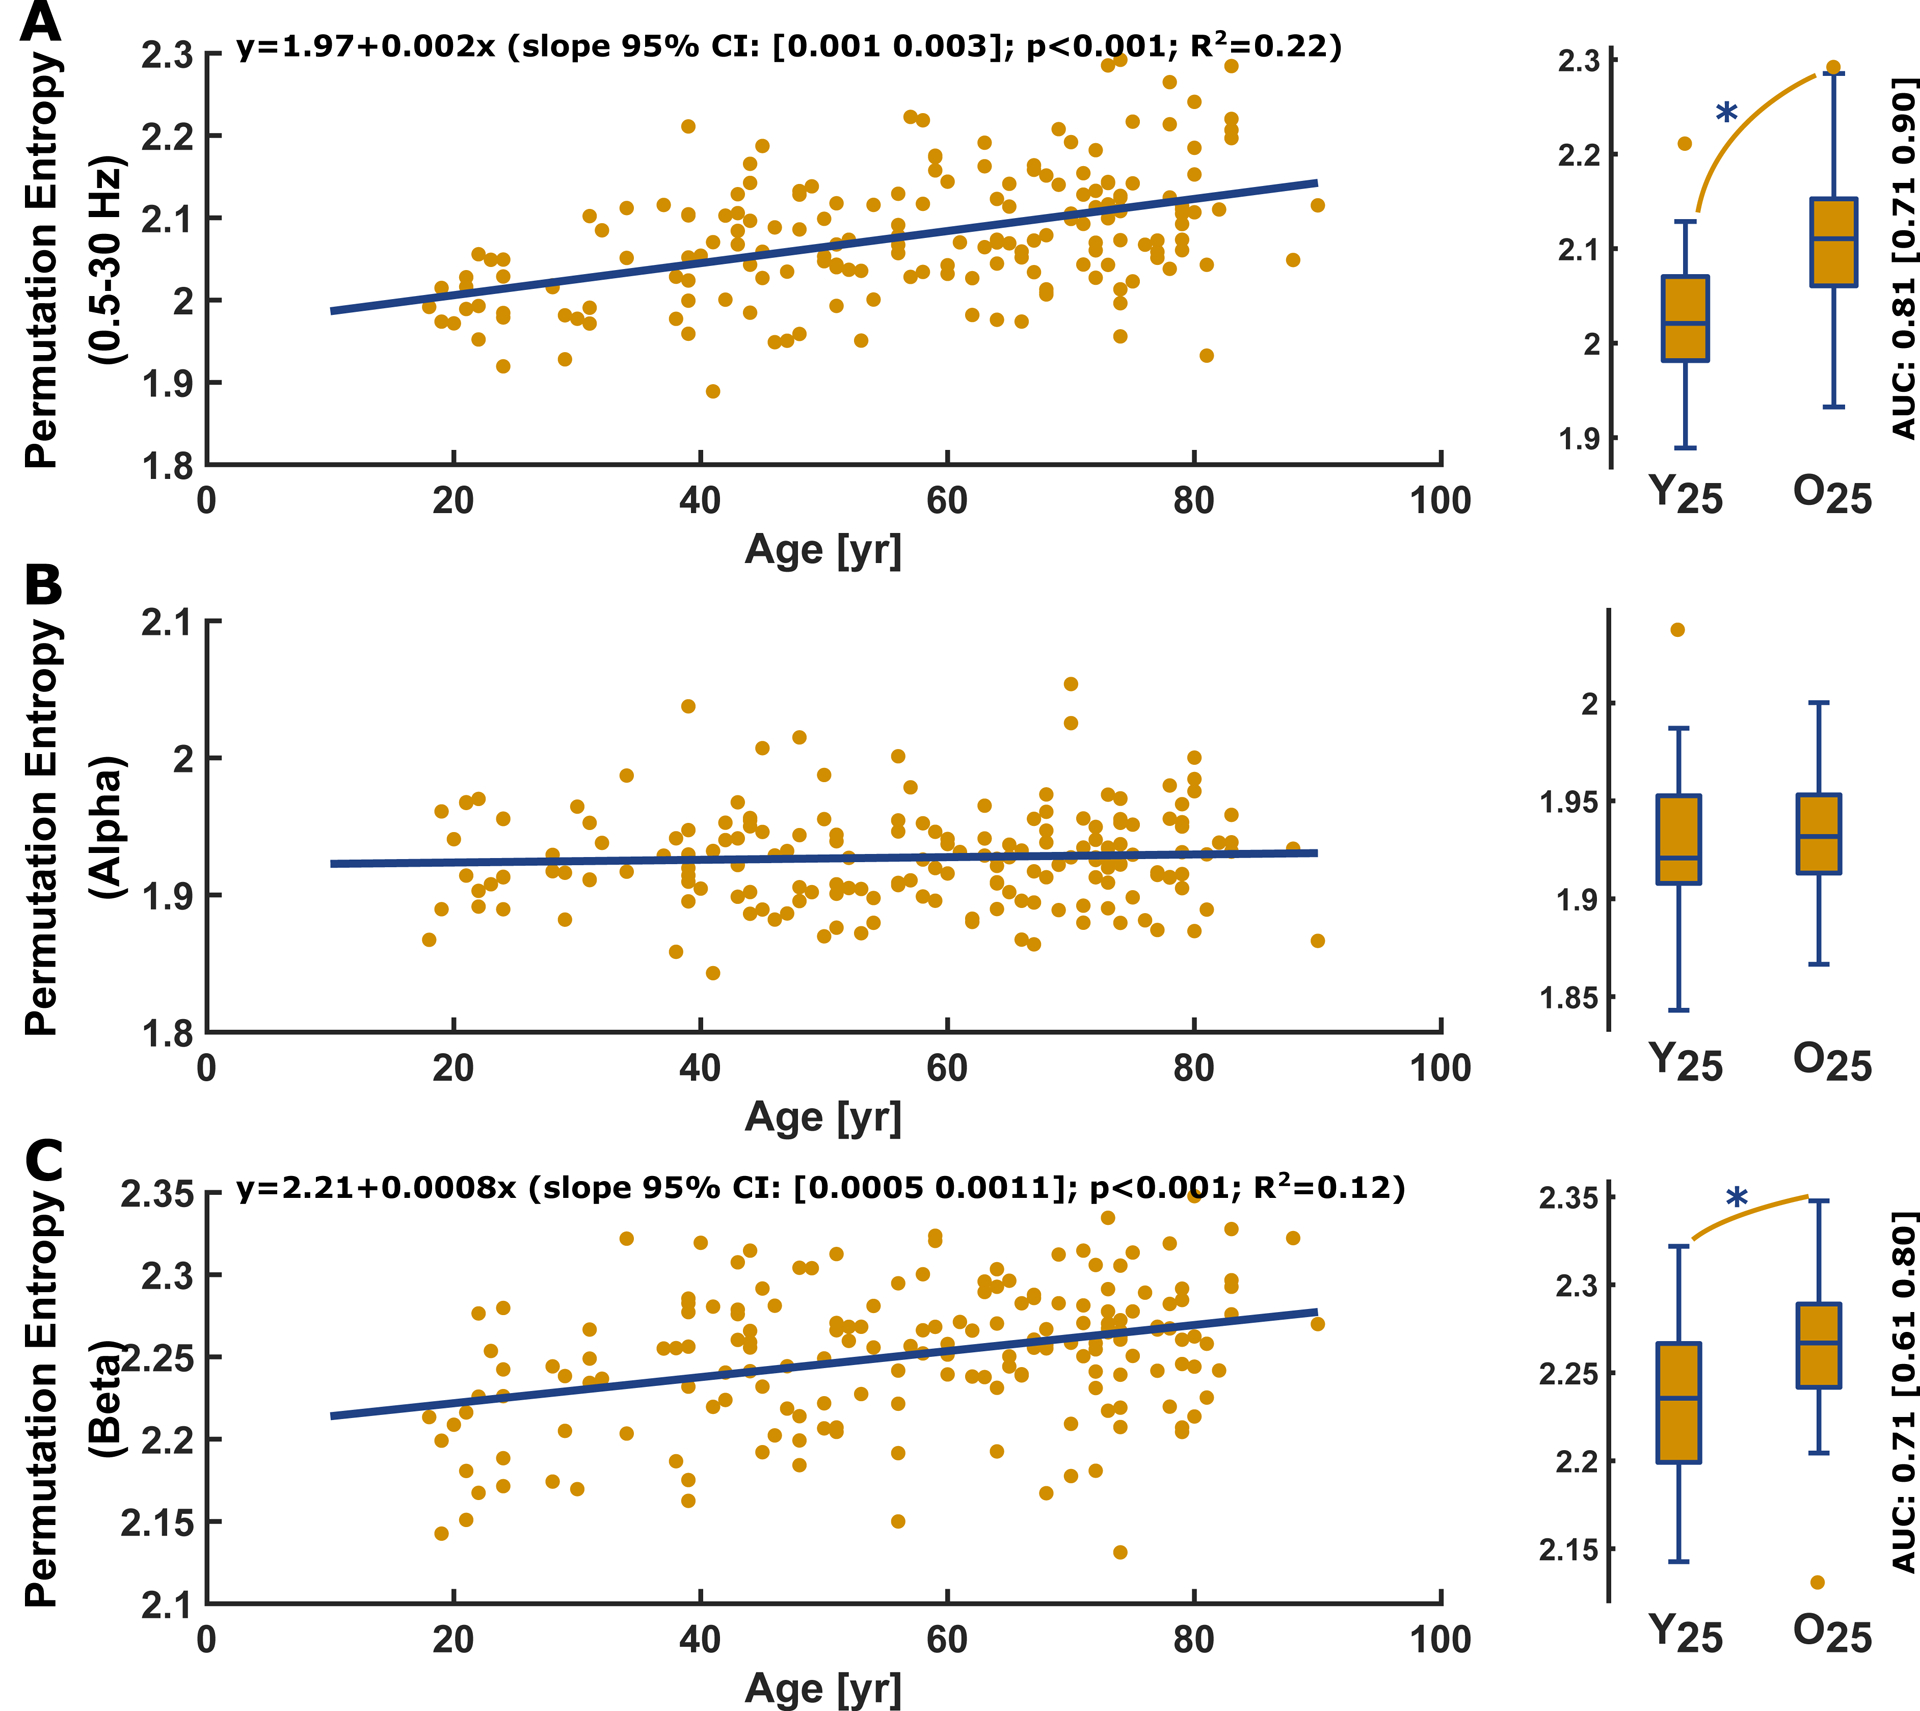
A) Permutation entropy of the 0.5–30 Hz filtered EEG significantly increased (p<0.001, t-statistic: 7.04) with age. Age had a “good” and significant (p<0.001; AUC=0.81 [0.71 0.90]) effect on permutation entropy as depicted in the comparison between Y25 (2.02 [1.98 2.07]) and O25 (2.11 [2.06 2.15]).
B) Permutation entropy of the alpha-band EEG showed no significant age-related effect (p=0.489, t-statistic: 0.69) and the AUC for the comparison between Y25 and O25 indicated no effect (p=0.384; AUC=0.55 [0.43 0.67]).
C) Permutation entropy of the beta-band EEG significantly (p>0.001, t-statistic: 4.95) increased with age. Age had a “fair” and significant (p<0.001; AUC= 0.71 [0.61 0.80]) effect on permutation entropy as depicted in the comparison between Y25 (2.24 [2.20 2.27]) and O25 (2.27 [2.24 2.29]).
In the regression plots, the yellow dots present the single patients and the blue line the linear fit. In the boxplots, the circles indicate outliers as defined by the MATLAB plotting routine. They were not excluded from analysis. Y25: youngest 25% O25: oldest 25%; yr: year