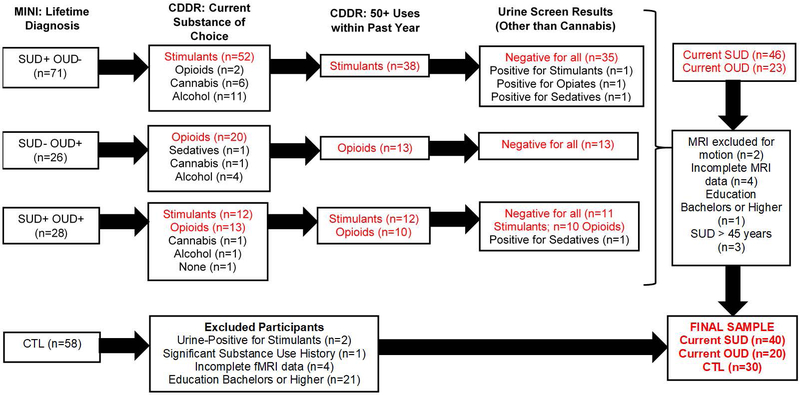
Figure 1.
Diagram highlighting participant inclusion and exclusion into three groups for statistical analysis: Current stimulant use disorder (SUD; n = 40), current opioid use disorder (OUD, n = 20), and healthy comparison subjects (CTL, n = 30). MINI = MINI international neuropsychiatric interview. CDDR = Customary Drinking and Drug Use Record. MRI = magnetic resonance imaging.

