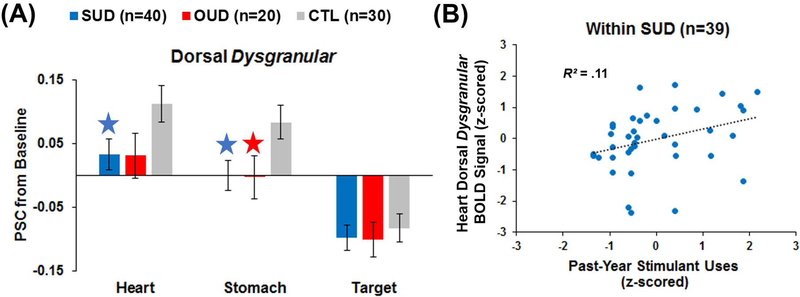
Figure 4.
(A) Group*region*condition interaction results for insular blood-oxygen-level dependent (BOLD) percent signal change (PSC) from baseline. SUD = current stimulant use disorder. OUD = current opioid use disorder. CTL = healthy comparisons. The blue stars indicates a significant difference for SUD versus CTL, whereas the red star indicates a significant difference for OUD versus CTL. Error bars reflect +/− 1 standard error. (B) Within SUD, greater past-year stimulant use was associated with higher dorsal dysgranular insula BOLD signal during the heart condition, sharing 11% of the variance.

