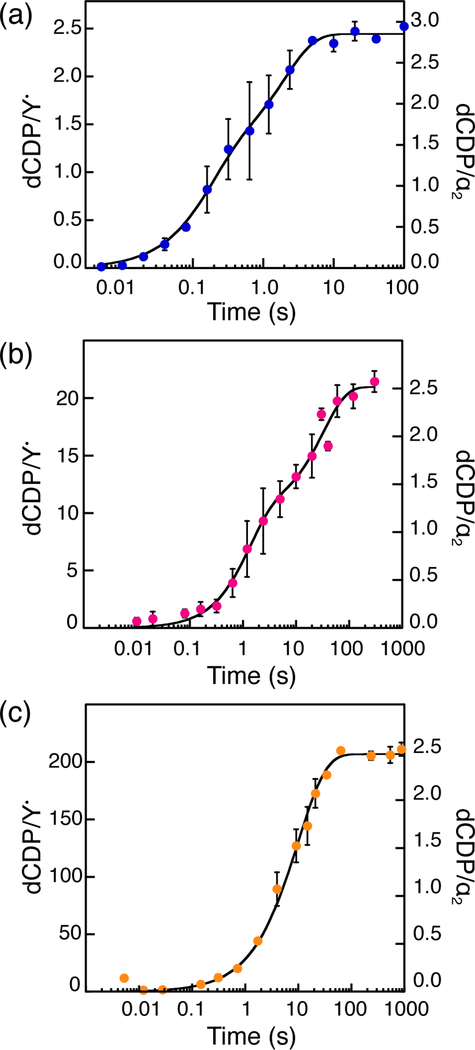
Figure 1.
Product formation kinetics measured by RCQ in the absence of reductant. Final reaction mixtures contained 10 μM α2, 0.5 mM CDP, 3 mM ATP and (a) 10 μM, (b) 1 μM, or (c) 0.1 μMβ2 as indicated. Circles and error bars represent the mean and average error of 2 trials, respectively. Black traces represent fits to Eq. 1 (a and b) or Eq. 2 (c) and produced the rate constants and amplitudes listed in Table 1.

