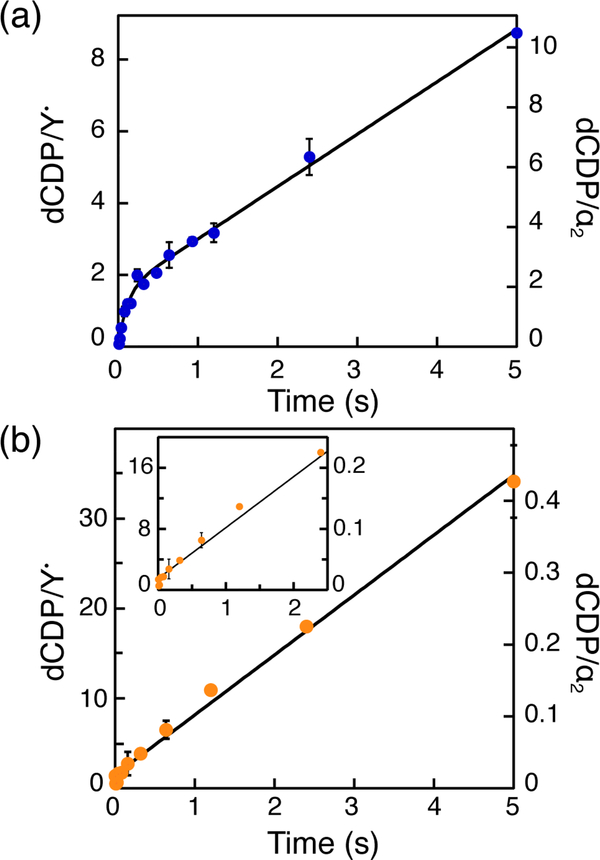
Figure 4.
dCDP formation kinetics measured by RCQ in the presence of TR/TRR/NADPH. Reaction mixtures contained α2 (10 μM), [5-3H]-CDP (1 mM), ATP (3 mM), TR (40 μM), TRR (0.8 μM), NADPH (1 mM), and β2 at either 10 μM, (a), or 0.1 μM, (b). Data points represent the averages of two trials. Black traces represent fits to Eq. 4 (a) or 5 (b).

