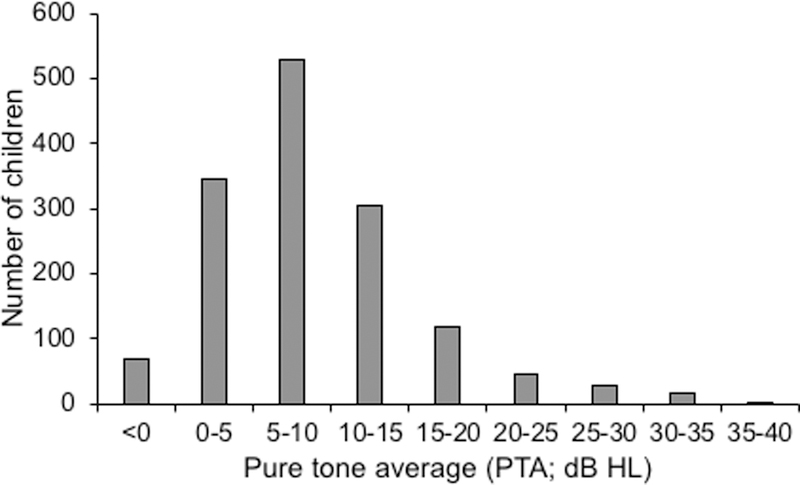
Fig. 3: Most children in the sample had low, sensitive pure tone thresholds.

. Distribution of pure tone average across all 4 threshold measures (2 frequencies x 2 ears) in the whole sample (N = 1457). For each range of PTA, only the lower measure is inclusive (e.g. 0–5 = 0–4.99).
