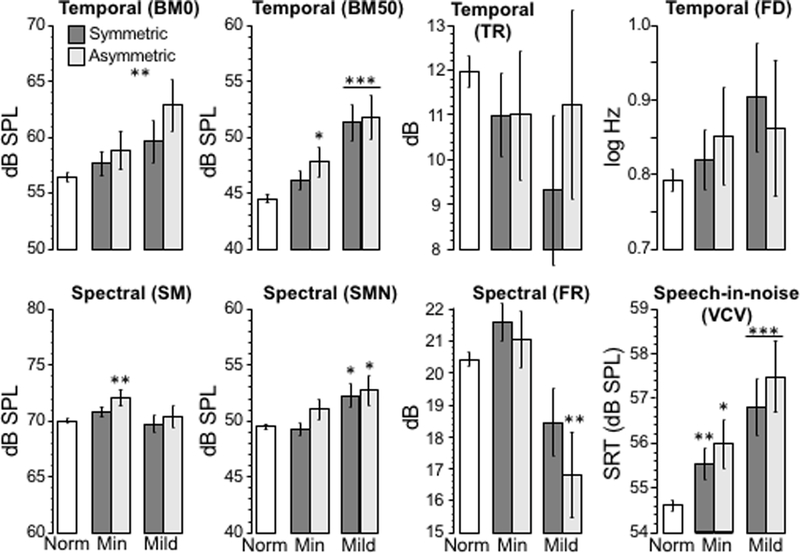
Fig. 4: Auditory perception was reduced in children with hearing loss.

. Histograms show mean (± s.e.m.), age-corrected threshold for AP tests (Fig.2). Age-corrections were estimated from ANCOVA models as expected scores at the overall mean age. Note that for most tests (BM0, BM50, FD, SM, SMN, VCV) a smaller value indicates better performance, but for TR and FR, a larger value indicates better performance. Stars indicate statistically significant differences between hearing loss and Normal hearing categories. * p < 0.05, ** p < 0.01, *** p < 0.001 (See Table 2 for details).
