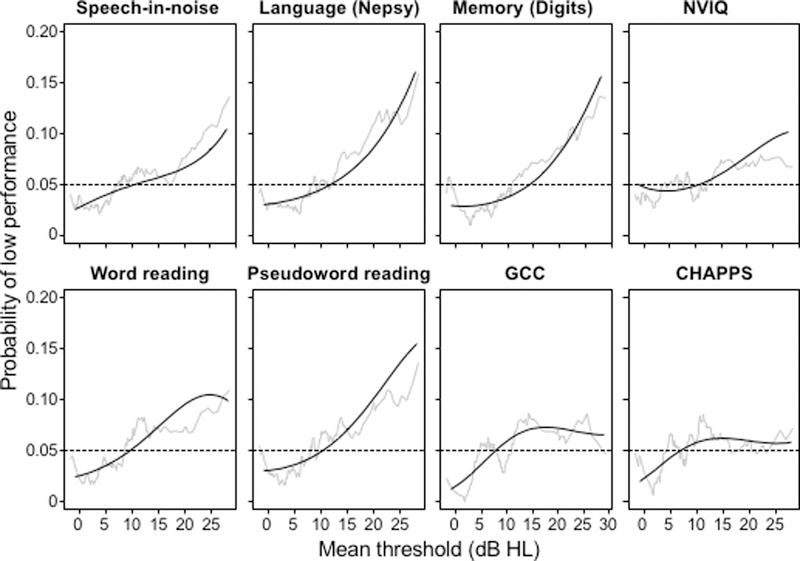
Fig. 7: Cognitive and Speech-in-noise performance declined progressively for HL>15dB.

Raw data (red lines, moving window average) and fitted data (black lines, cubic logistic regression) indicate the probability of a score for each test that was in the lower 5th percentile of scores on that test in the whole analysed sample (N = 1427; See Supplementary Information for further details).
