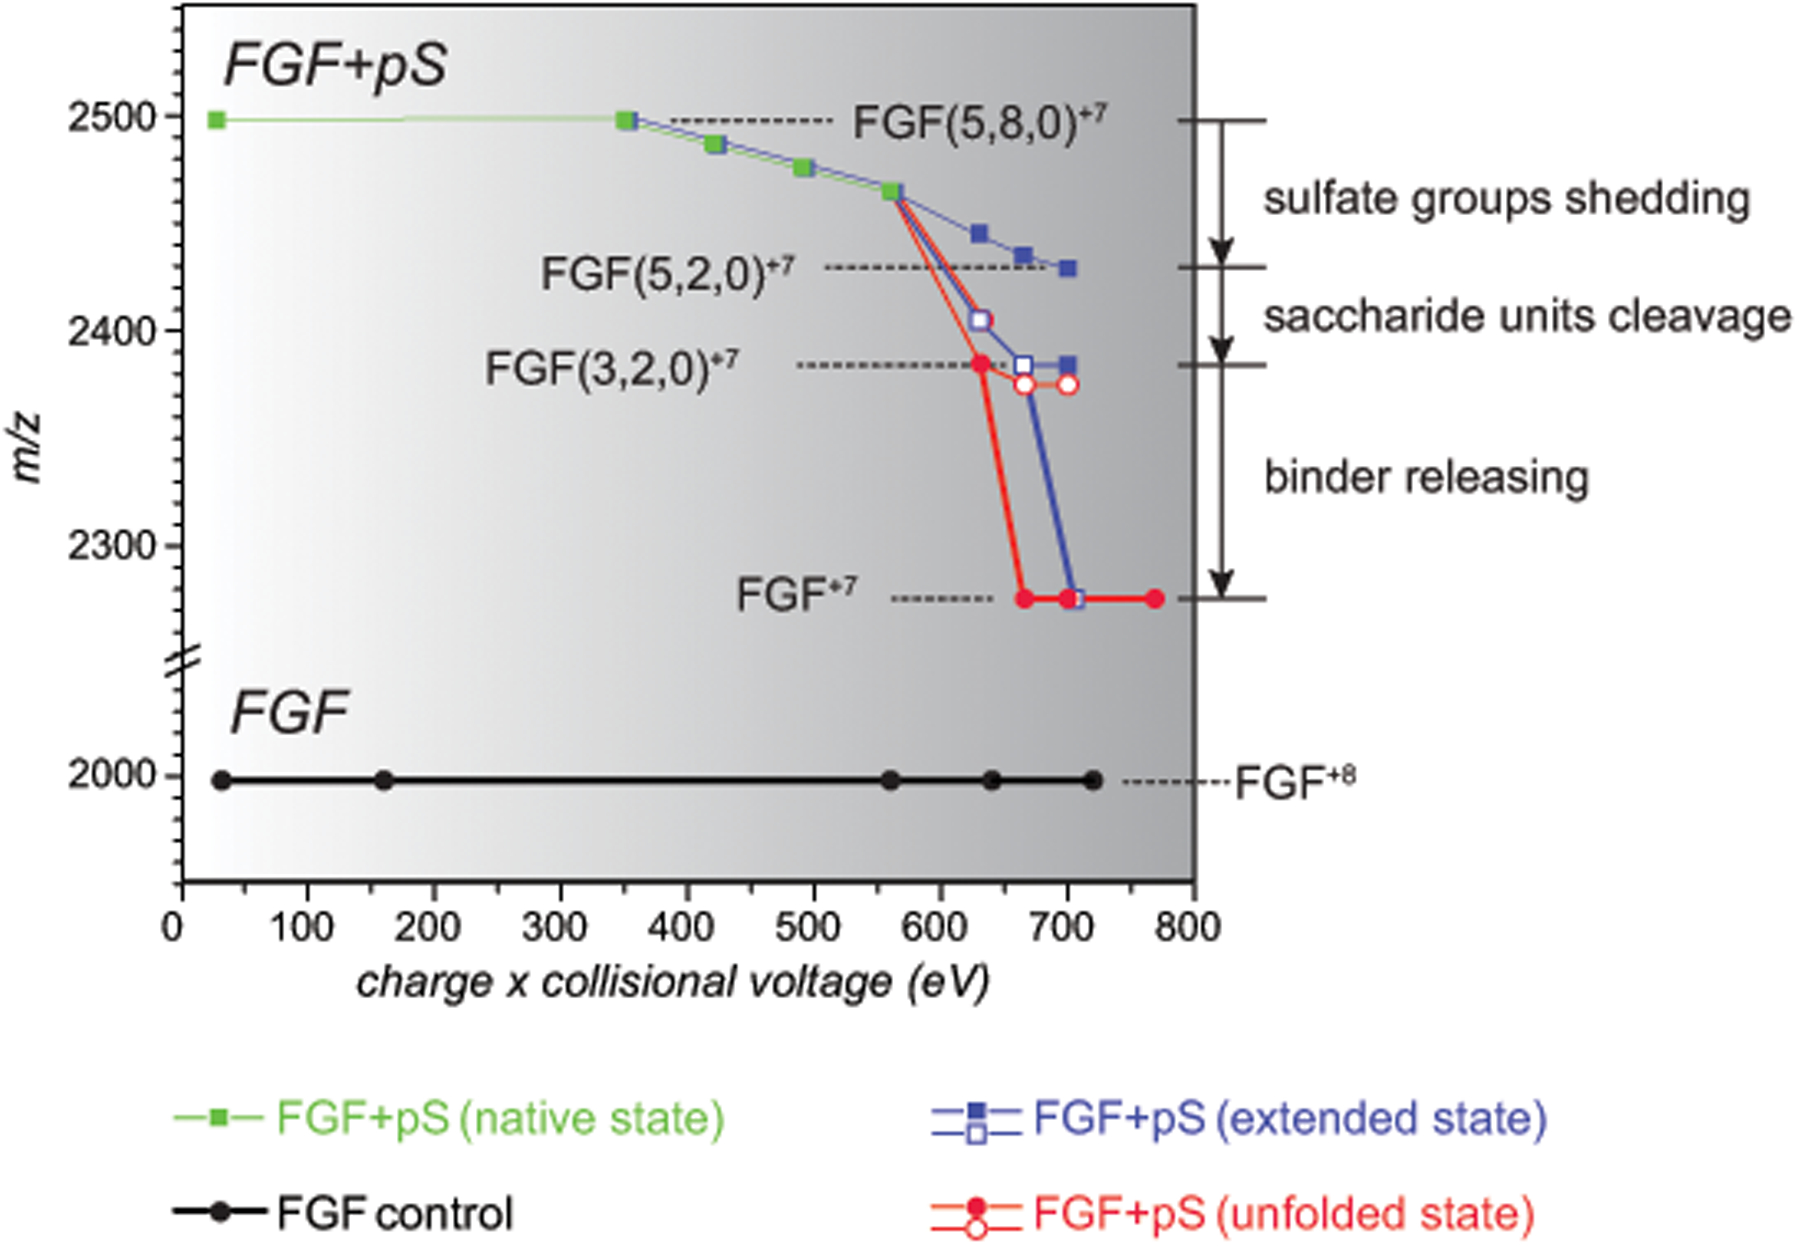
Figure 3.

Mass evolution of FGF·pS complexes as a function of collisional energy plotted for three different precursor conformations: native (green), partially unfolded (blue) and fully unfolded (red). The boldness of line indicates the category of mass change: sulfate shedding (thin), saccharide unit(s) removal (normal) and complete ligand release (bold). Only the lowest-m/z edge of the ionic distributions is represented on plot. The shaded squares/circles represent the dominant features in the mass spectra (relative abundance ≥ 45%); the minor features are represented with the open squares/circles.
