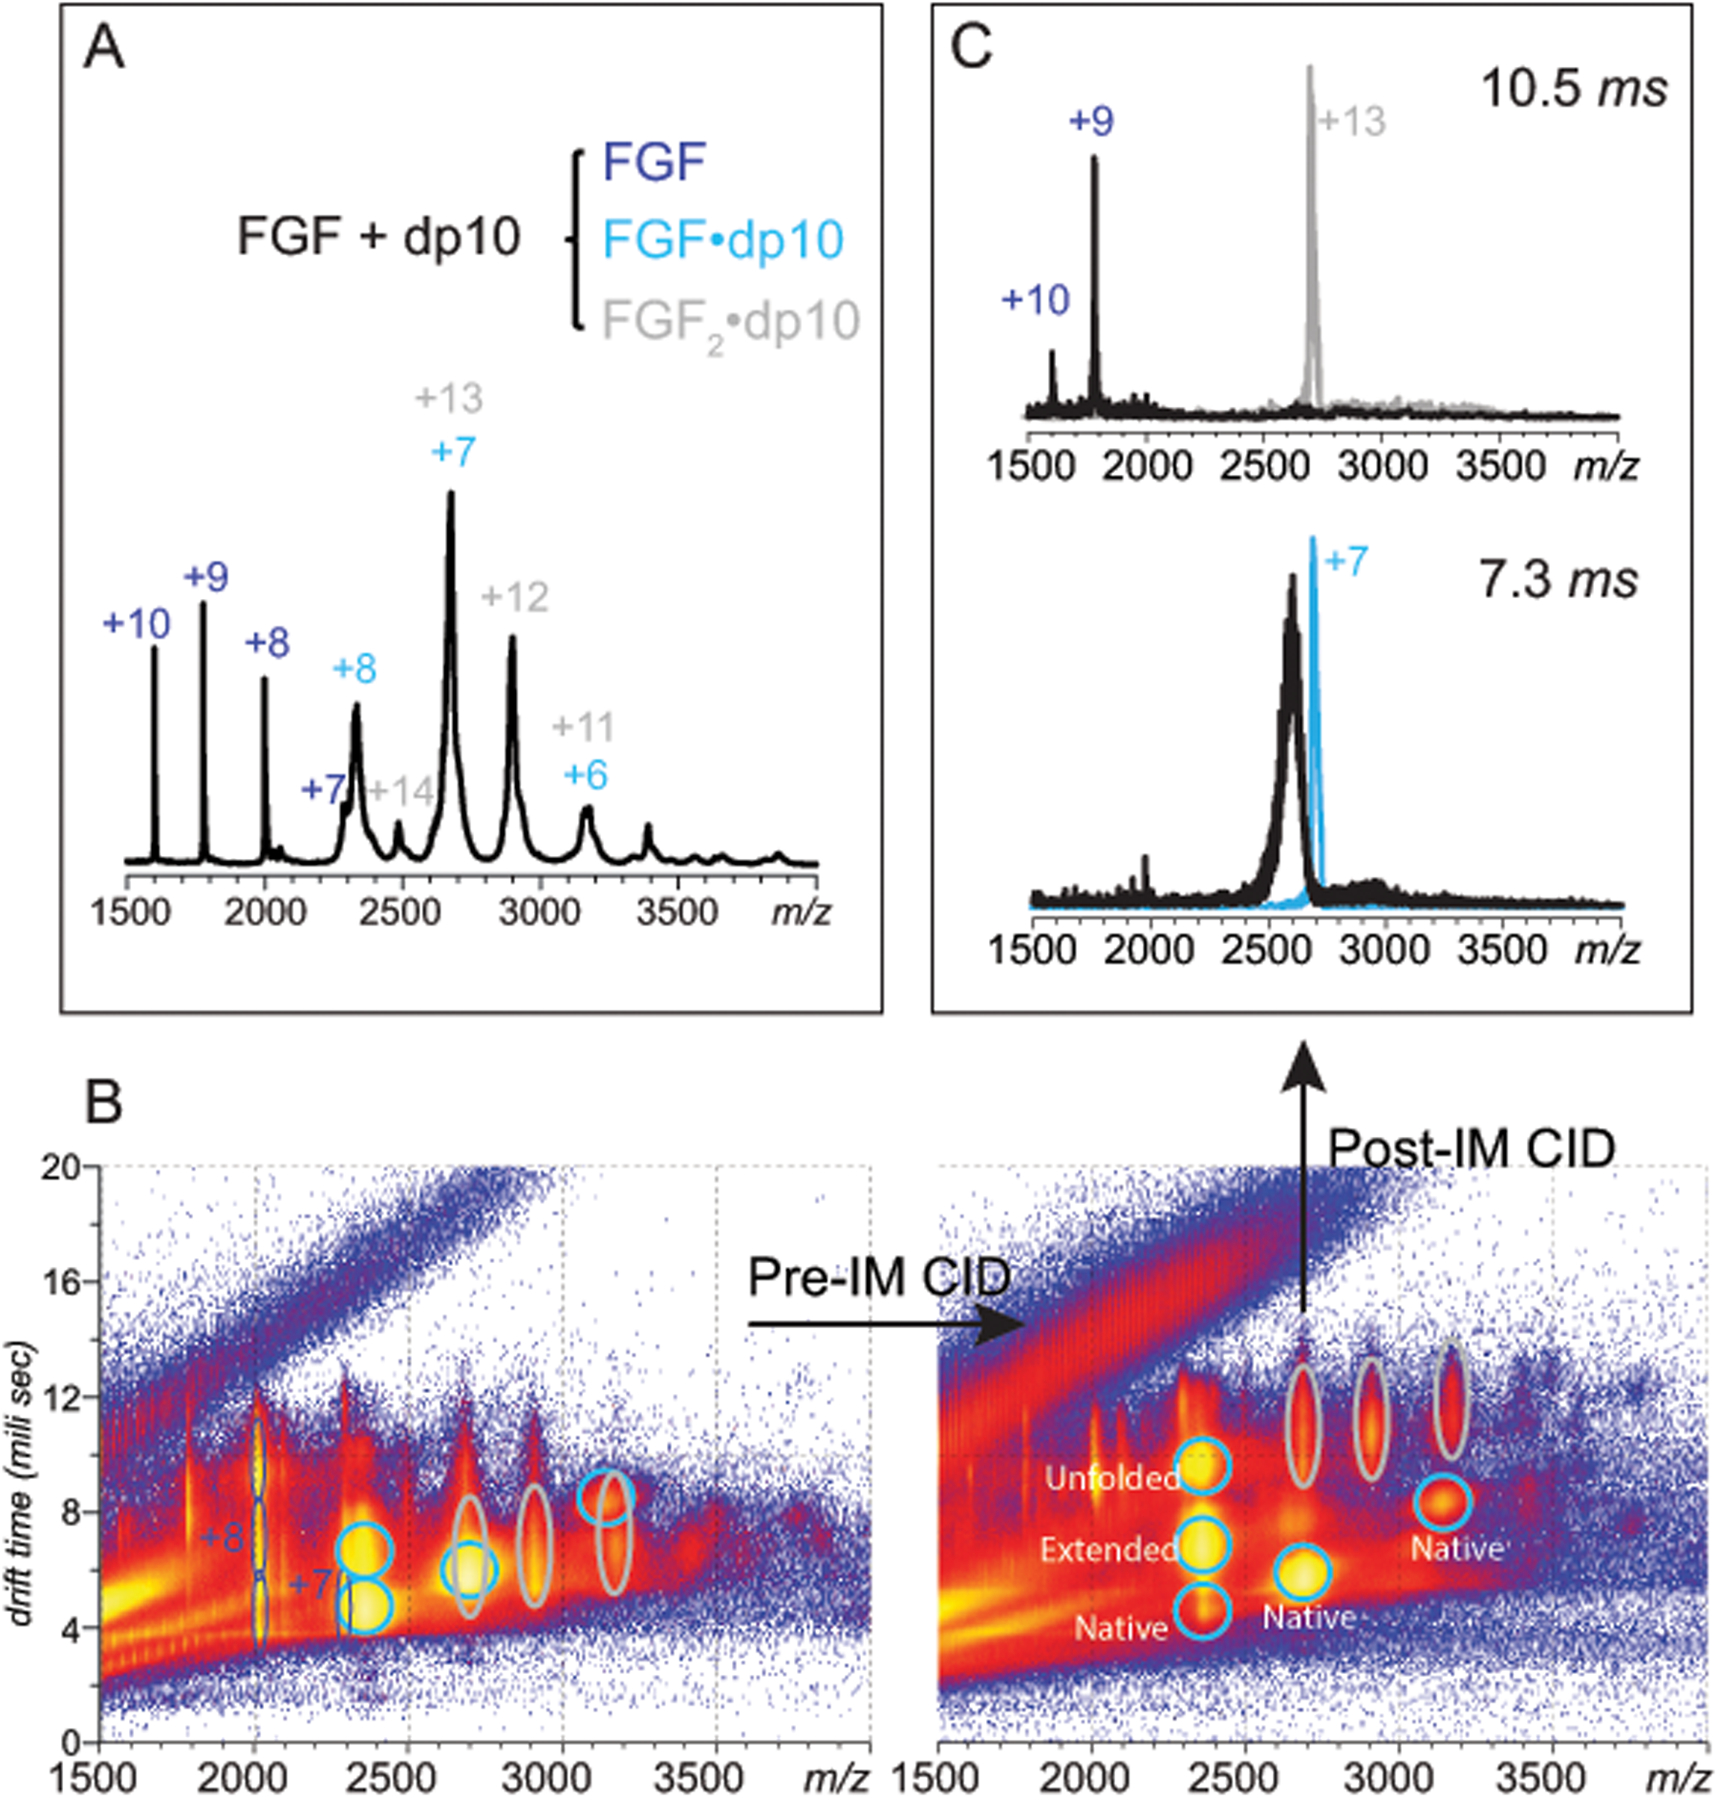
Figure 4.

Native MS/IMS characterization of SEC-purified FGF/dp10 complexes. A: a mass spectrum of the FGF/dp10 in 100 mM ammonium acetate; the charge states are labeled for the heparin-free protein (blue), as well as for 1:1 (cyan) and 2:1 (gray) FGF/dp10 complexes. B (left panel): a two-dimensional IMS/MS plot of for the mass spectrum shown in (A) showing significant overlap of ions representing FGF/dp10 complexes with different stoichiometries (cyan and gray ovals) in both m/z and drift time domains (left). B (right panel): modest pre-IM collisional activation (10 V) allows the ions representing the two different FGF/dp10 complexes to be completely separated. C: the pre-IM separated complexes can be activated independently post-IM, giving rise to distinct fragmentation patterns at collisional activation of 80 V.
