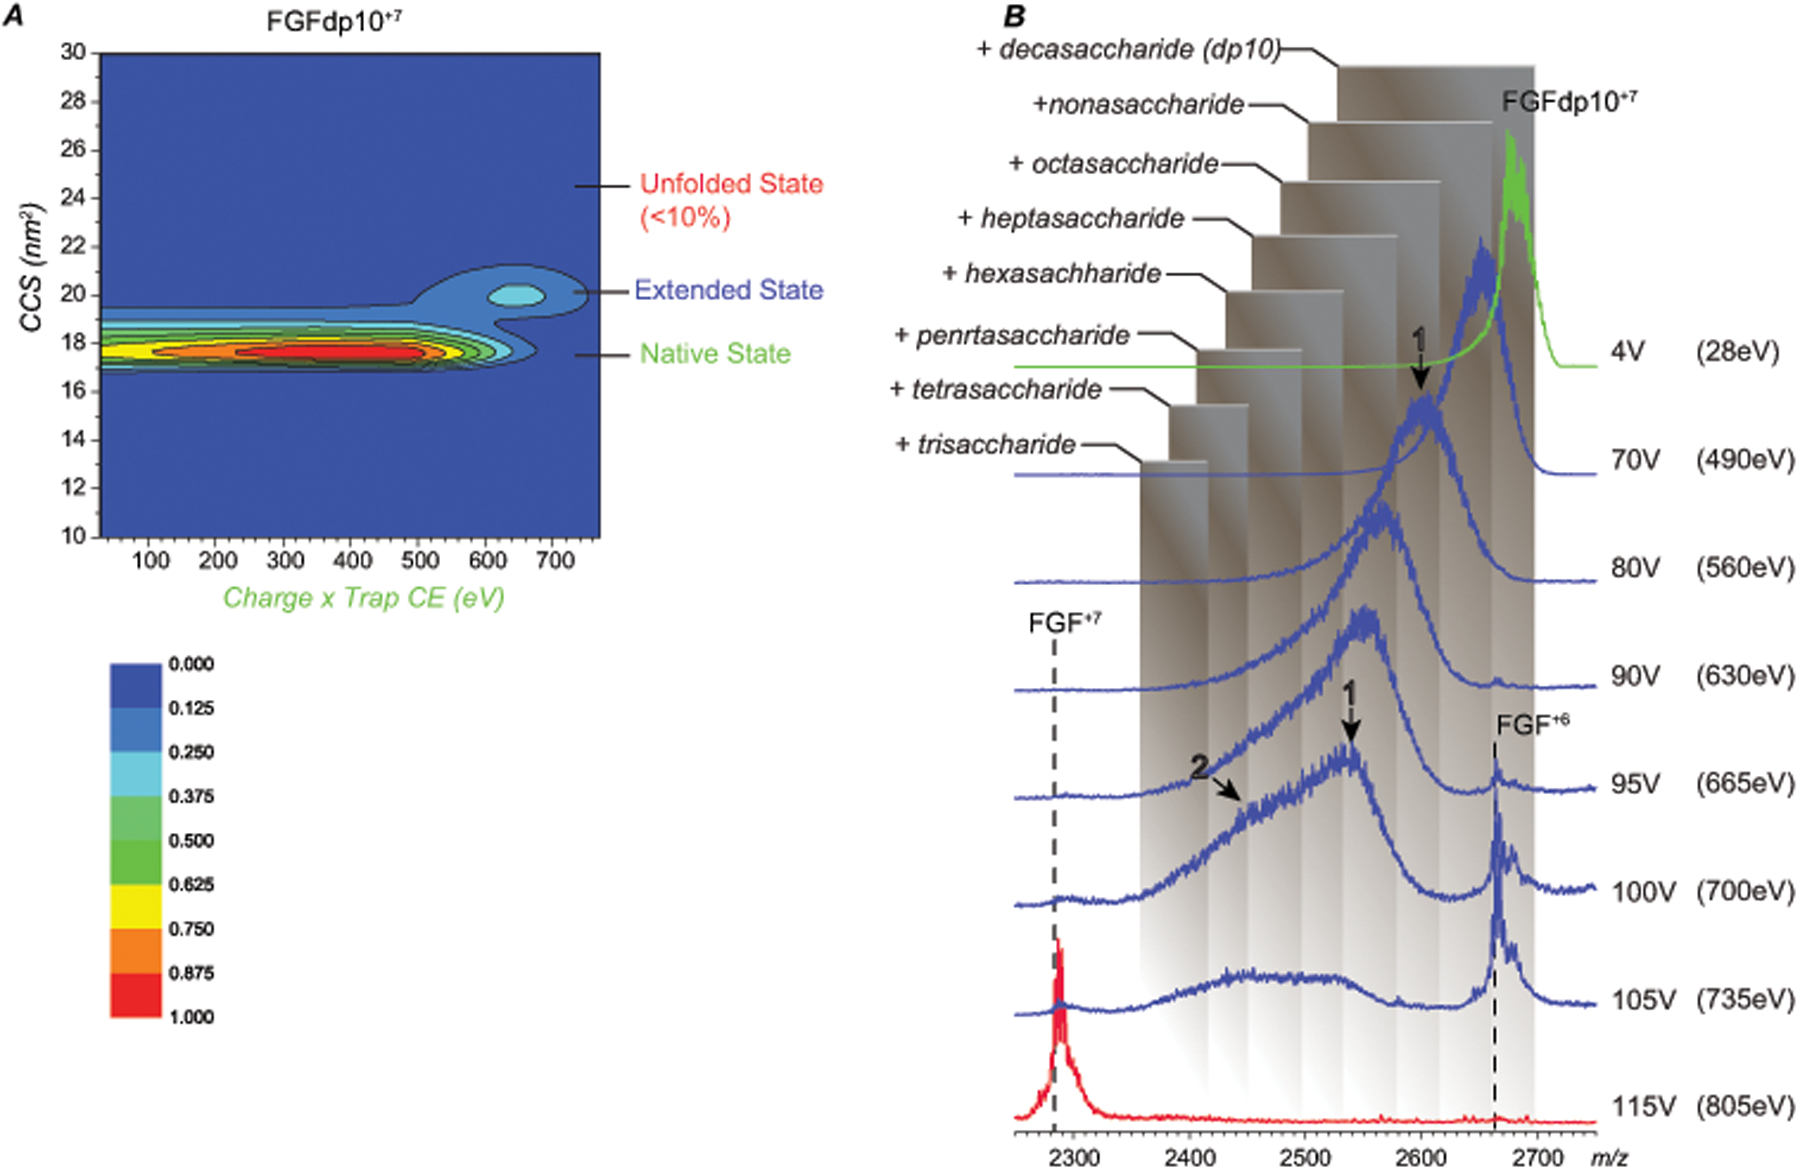
Figure 5.

CCS (A) and m/z (B) evolution of ions representing the 1:1 FGF/dp10 complex (charge state +7) following collisional activation. The shaded boxes in panel B represent m/z ranges for FGF bound to truncated forms of the heparin oligomer of varying lengths.
