Fig. 4.
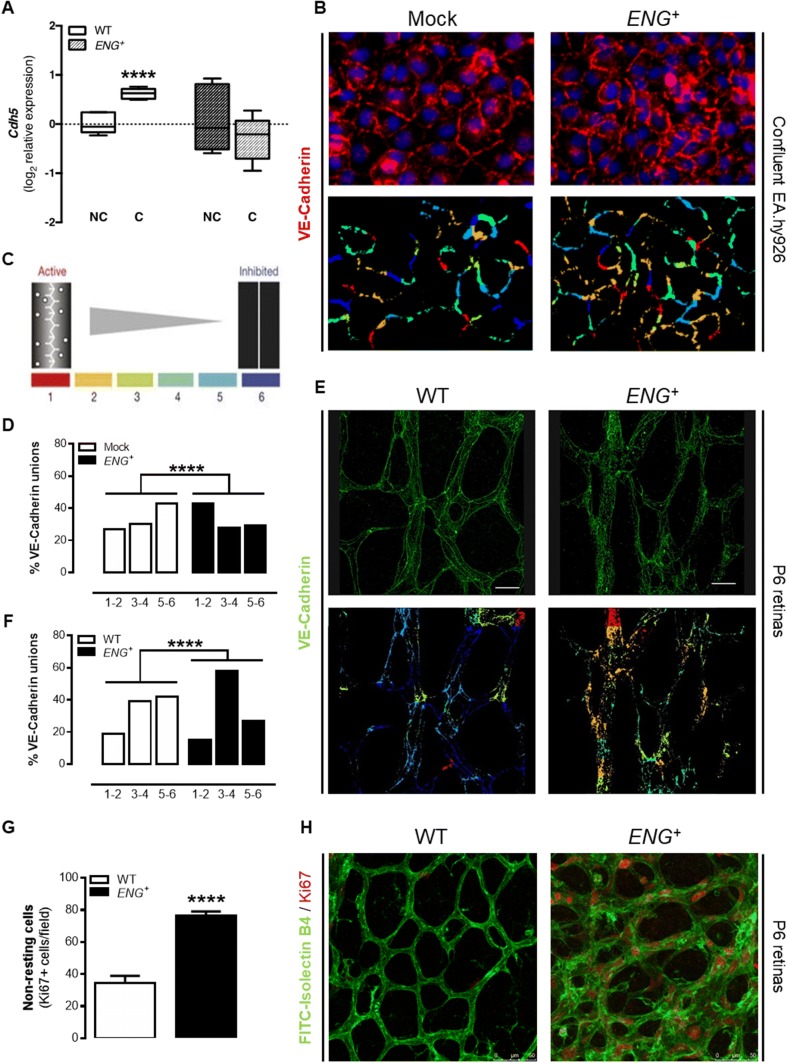
Continuous endoglin overexpression alters endothelium stability in vivo. a qPCR analysis of Cdh5 expression in confluent (C) and nonconfluent (NC) MLECs [n(WT) = 6, n(ENG+) = 6; p = 0.0237]. b Upper panel: VE-cadherin staining in confluent EA.hy926 ECs. Lower panel: pattern of VE-cadherin junctions in confluent EA.hy926 ECs, using the “patch algorithm” in MATLAB™. c Schematic illustration of patch classification numbers and colors used to quantify the pattern of VE-cadherin junctions. d Quantification of each type of junction in confluent EA.hy926 ECs [n(WT) = 10, n(ENG+) = 10; p < 0.0001]. e Upper panel: VE-cadherin staining in the retinal vasculature of P6 pups. Lower panel: Pattern of VE-cadherin junctions in the retinal vasculature of P6 pups, using the “patch algorithm” in MATLAB™. f Quantification of each type of junction in the retinal vasculature of P6 pups [n(WT) = 13, n(ENG+) = 12; p < 0.0001]. g Quantification of non-resting (Ki67+) cells in the central area of the retinal vasculature of P6 pups [n(WT) = 4, n(ENG+) = 5; p < 0.0001]. h Ki67 (red) and FITC-lectin (green) staining in the central area of the retinal vasculature of P6 pups

