Fig. 1.
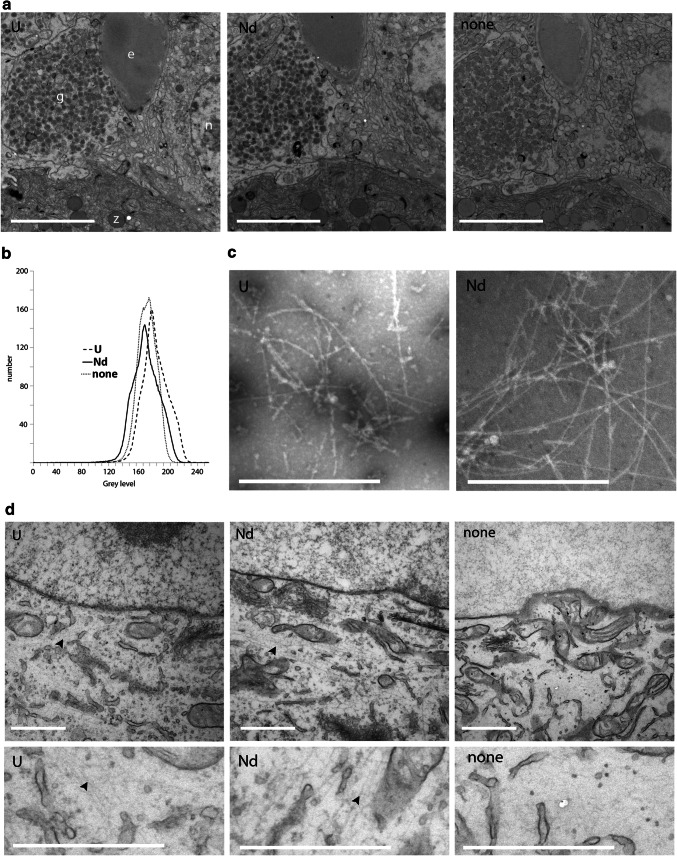
Neodymium acetate replacing uranyl acetate for contrasting EM samples. a TEM images of 100 nm sections rat pancreas embedded in EPON stained with either 2% uranyl acetate, 4% neodymium acetate or without any stain showing an increased contrast of UAc and NdAc compared to no staining. To visualize the difference in contrast images were recorded with same beam spreading and fixed scaling. e erythrocyte, n nucleus, g glucagon granules, z zymogen granules. Note that only the first panel is annotated, because the other two show the same structures. Bars: 5 µm. b Overlays of histograms of images in a, showing the distribution of grey values. NdAc (solid line) and UAc (dashed line) have more grey values, so more contrast, compared to a non-contrasted sample (dotted line). c Negative stain with NdAc or UAc show same structures and contrast applied to amyloid-β fiber ultrastructural examination. Bars: 0.5 µm. d In situ staining (en bloc staining) of U2OS cells with UAc or NdAc gives contrast to proteins in the cytoplasm as well as the nucleus compared to no staining where only osmium contrast is seen in mainly membranes. Note that Nd even stains cytoskeletal proteins more clearly compared to UrAc (arrowheads), which are not visible at all in the none contrasted sample. Bars 1 µm

