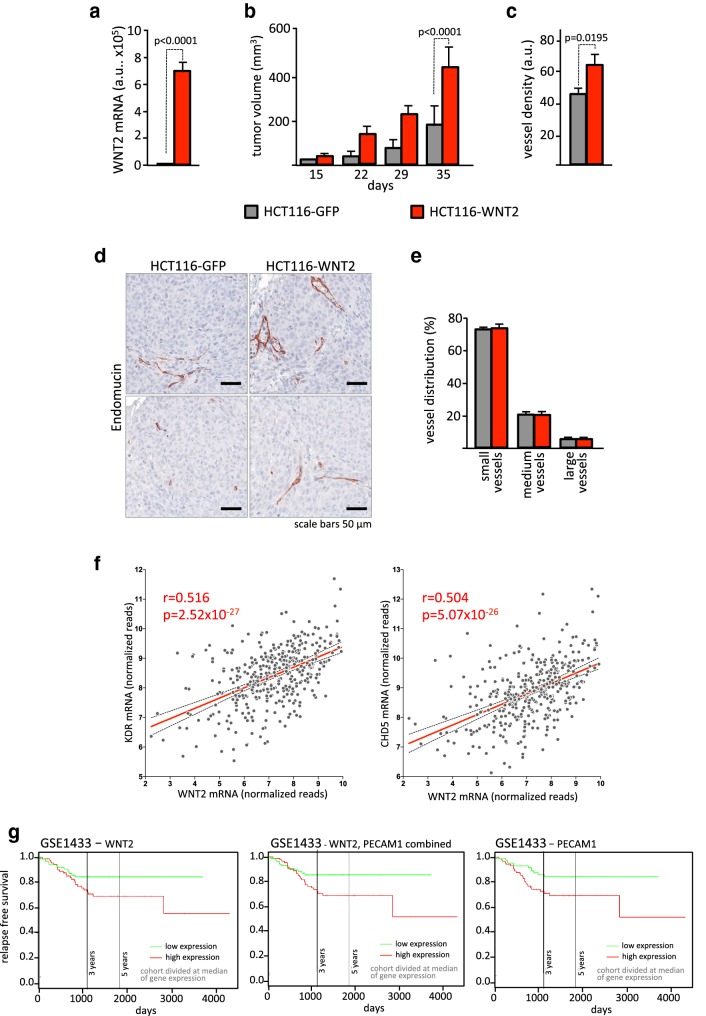
Fig. 4.
WNT2 overexpression is associated with increased angiogenesis in vivo. a WNT2 expression was assessed in HCT116 cells either expressing GFP (HCT116-GFP, gray) or WNT2 (HCT116-WNT2, red) by RT-qPCR analysis. b 1 × 10⁵ cells were subcutaneously injected into SCID mice and tumor growth was measured. c Vessel density was quantified by Endomucin IHC staining and image analysis using Tissue Studio. d Two representative images are shown. Vessels (Endomucin+) are stained with AEC (brown). e The distribution of small, medium, and large vessels within the two groups was assessed with Tissue Studio. b, cn = 4 for HCT116-GFP and nn = 3 for HCT116-WNT2, and bars are means; error bars represent SEM. P values are indicated. f Correlation of WNT2 and VEGFR2 (KDR) as well as VE-cadherin (CDH5) mRNA expression in 382 CRC patients using the TCGA COADREAD RNASeq dataset. Gray dots represent individual samples; red line illustrates linear regression. Confidence interval (95%) is shown (dotted lines). Pearson’s correlations and P values are indicated. g Survival analysis of 290 CRC patients using the Sieber (GSE14333) dataset. Data were bifurcated for high and low WNT2, PECAM1, or WNT2/PECAM1 expression at the median and a Kaplan–Meier plot was generated with SurvExpress [74]. Red, high; green, low expression of WNT2, PECAM1, or WNT2/PECAM1.

