Figure 2.
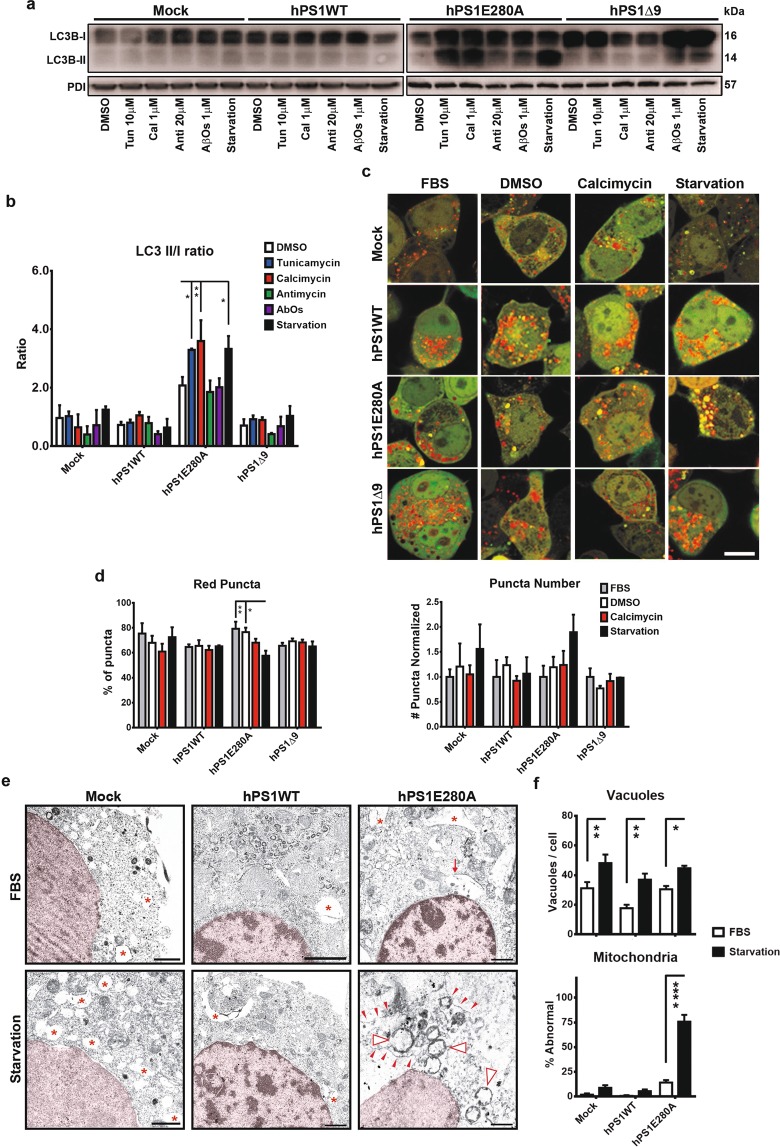
Abnormal autophagy in hPS1E280A N2a cells. (a) Steady state levels of LC3B I and II in N2a cells overexpressing hPS1, hPS1-E280A or hPS1Δ9 after tunicamycin, calcimycin, antimycin, AβOs, or serum starvation treatment. (b) LC3B densitometric quantification normalized to PDI and compared to basal conditions. LC3B conjugation (assessed by measuring LC3B-II/LC3B-I ratio) was increased in hPS1E280 cells after tunicamycin, calcimycin, and serum starvation treatments, while PS1Δ9 mutation showed no statistically significant differences. Mean ± SEM Two-Way ANOVA *p < 0.05, **p < 0.01, ***p < 0.001, ****p < 0.0001, n = 3. (c) Monitoring of autophagy turnover using N2a cells transfected with the RFP-GFP-LC3B construct. Transfected cells were treated with vehicle (DMSO) and stressors (calcimycin and serum starvation). The transition from autophagosomes (yellow) to autolysosomes (red) is detected by the loss of GFP fluorescence upon acidification of the autophagolysosome (for visualization of green and red channels, see Fig. S4). Bar = 1 μm. (d) Puncta quantifications showed significant differences in hPS1E280A cells by measuring whether red (decreased lysosomal degradation) or yellow (increased autophagosome formation) puncta. *P < 0.05, data are mean ± SEM, Two-Way ANOVA. (e) Ultrastructure analysis of basal and serum starved (16 h) mock, overexpressing hPS1WT, and hPS1E280A N2a cells (n = 3 independent experiments for each cell line). In basal conditions, hPS1E280A cells can show autophagic vacuoles but after 16 h of serum starvation, mitochondrial lysosomal degradation can be observed. Red asterisks = vacuoles, Red arrows = autophagic vacuoles, red arrowheads = lysosomal membrane, open arrowheads = degrading mitochondria. (f) Serum starvation significantly increased the number of vacuoles in all evaluated cell lines and only hPS1E280A cells it presented a significantly increased percentage of abnormal mitochondria (at least 10 cells and at least 130 mitochondria were evaluated from each cell line and condition). *P < 0.05, **P < 0.01, ****p < 0.0001; data are mean ± SEM, Two-Way ANOVA.

