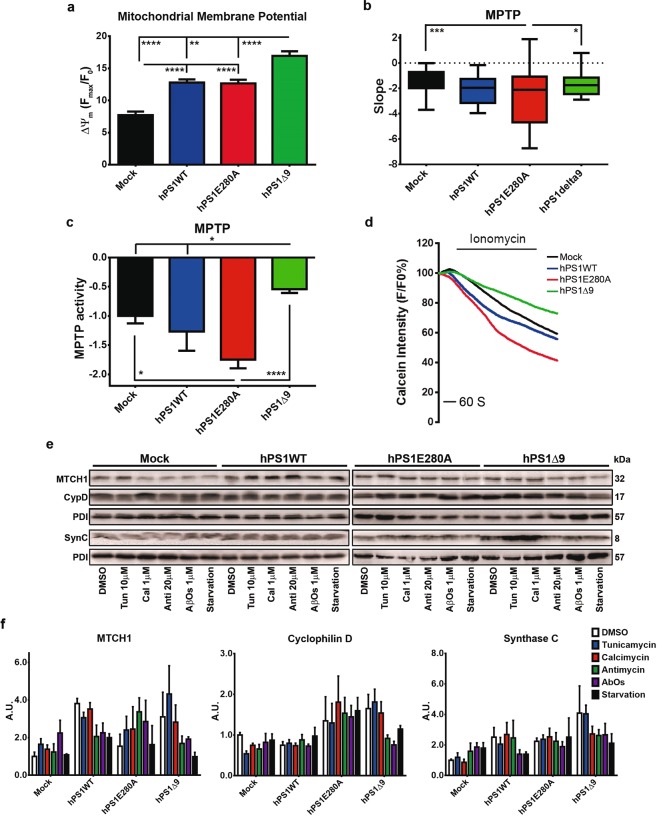
Figure 4.
PS1 mutations lead to mitochondrial stress and abnormal mitochondrial permeability transition pore opening. (a) Bar graphs representing TMRM intensity as measurement of mitochondrial membrane potential (ΔΨm) during live imaging. All hPS1 overexpressing cells showed increased potential compared to mock and hPS1Δ9 showed increased potential when compared to all other cell lines. (b) Cells were challenged with H2O2 500 μM to induce mPTP opening and depolarize mitochondria, using TMRM intensity for assessment. hPS1E280A MPTP opening was accelerated compared to mock. SEM, **p < 0.01, ***p < 0.001, n = 93–158. (c) MPTP opening in N2a cells assessed with the Co2+ -calcein assay in three independent cell cultures of N2a cells overexpressing hPS1, hPS1-E280A or hPS1Δ9. Cells were challenged with 1 μM ionomycin (Sigma-Aldrich, Hamburg, Germany) to induce MPTP opening and quenching of the calcein signal. PS1 mutant cells showed altered MPTP opening, accelerated in hPS1E280A and inhibited in hPS1Δ9 cells. (d) Representative timeline of calcein intensity quenching after the addition of ionomycin in hPS1 overexpressing and mock N2a cells. (e) Representative western blots for MPTP (Cyclophilin D, CypD and ATP synthase C, SynC) or PS1 associated (MTCH1) mitochondrial proteins in N2a cells after stress treatments. (f) Bar graphs of densitometric analysis of steady state levels of CypD, SynC and MTCH1. Only hPS1WT overexpressing cells presented significantly increased MTCH1 levels. PS1-Mutants showed increased general steady state levels of CypD and SynC independent of stress. All data are mean ± SEM, Two-Way ANOVA, *p < 0.05, **p < 0.01, ***p < 0.001, ****p < 0.0001.

