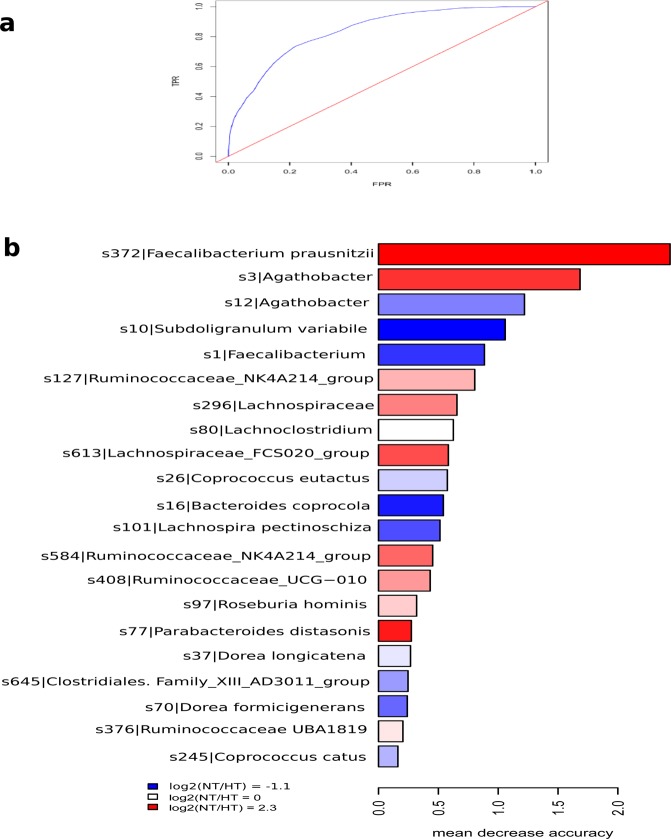
Figure 4.
Random forest analysis at ASV level. (a) ROC curve using ASVs as variables. FPR, False Positive Rate, TPR, True Positive Rate. (b) The most discriminatory ASVs to classify individuals into NT or HT group. The colour indicates the enrichment in NT (red) or HT (blue) based on the log2 fold change between the relative abundance average of NT group and the relative abundance average of HT group. Length of bars represents the discriminatory power of the variables.

