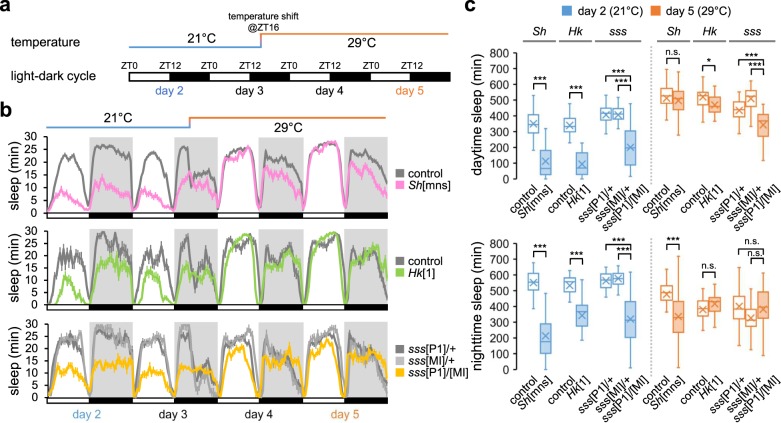
Fig. 1. Sh and Hk mutants display short sleep phenotypes in a temperature-sensitive manner.
a A schematic of 12-h light (white bars):12-h dark (black bars) cycles and a temperature shift for monitoring temperature-adaptive sleep behaviors. b Sleep profiles of Sh (pink line, n = 68), Hk (green line, n = 27), sss mutants (yellow line, n = 29), and their controls (gray lines, n = 20–122). Sleep behaviors were analyzed in individual male flies and averaged for each genotype. Error bars indicate SEM. c Box plots represent the total amounts of L or D sleep on day 2 (21 °C, blue boxes) versus day 5 (29 °C, orange boxes) (n = 20–122). Each box plot ranges from lower Q1 to upper Q3 quartile; crosses and horizontal lines inside each box indicate mean and median values, respectively; whiskers extend to minimum or maximum values of 1.5 × interquartile range. n.s., not significant; *P < 0.05, ***P < 0.001 as determined by Aligned ranks transformation ANOVA, Wilcoxon signed-rank test.

