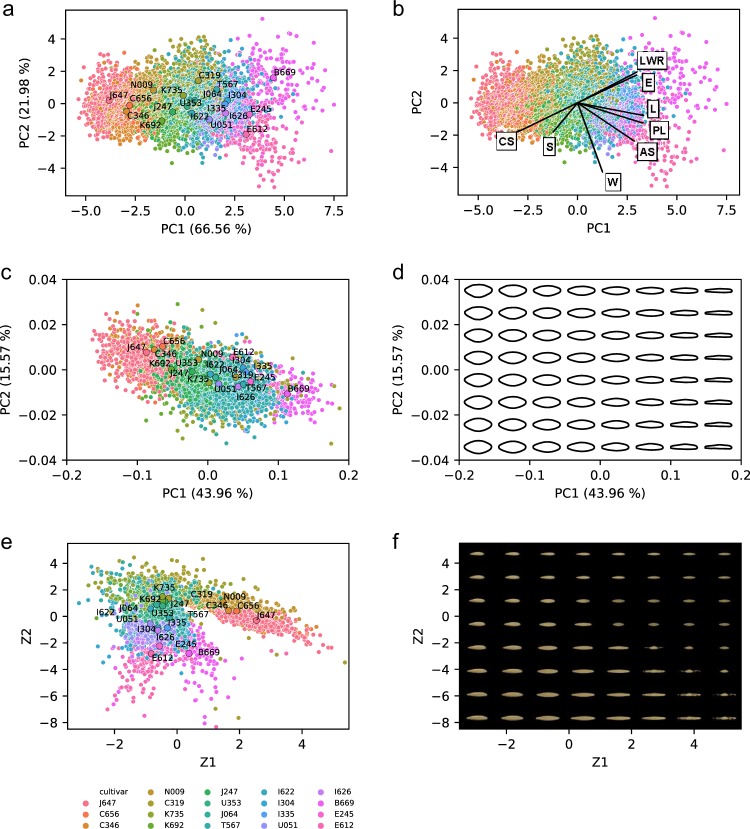
Fig. 5. Multivariate analysis of barley seed morphology.
a, b Principal component analysis (PCA) with morphological parameters of barley seeds. Each point represents the data point of the respective seed. The colors correspond to those defined in the color legend displayed below (e). Mean PC1 and PC2 values of each cultivar are plotted as a large circle with text annotations in (a). Eigenvectors of each descriptor are drawn as arrows in (b). LWR length-to- width ratio, E eccentricity, L seed length, PL seed perimeter length, AS seed area, W seed width, S solidity, CS seed circularity. c, d PCA with elliptic Fourier descriptors (EFD). The colors and points annotated of (c) follow those of (a). Interpolation of the latent space followed by reconstruction of the contours are displayed in (d). e, f Latent space visualization of variational autoencoders (VAE). The colors and points annotated of (e) follow those of (a). Interpolation of the latent space followed by image generation using the generator of VAE are displayed in (f).

