Figure 3.
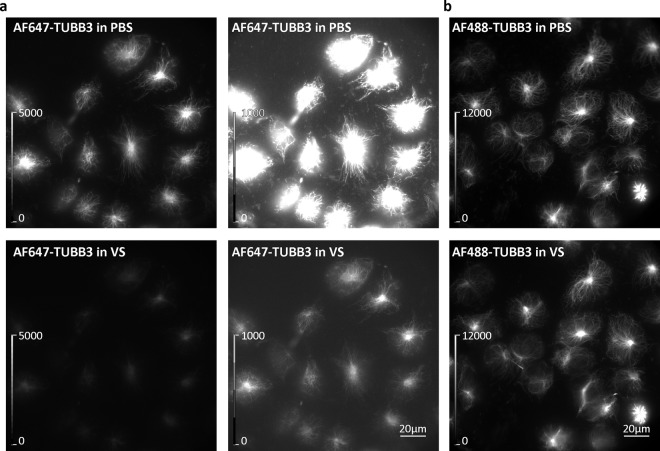
Effect of Vectashield (VS) on the fluorescence of AF647- and AF488-labelled microtubules. (a) Widefield images of ND7/23 cells labelled with AF647-conjugated anti-tubulin β3 (AF647-TUBB3) antibody in PBS (upper panels) and in VS (lower panels). To ensure the quenched AF647 signal in VS is visible, the same images are shown on the right with different linearly adjusted brightness and contrast levels (as indicated by look-up table (LUT) intensity scale bars). (b) Widefield images of ND7/23 cells labelled with AF488-conjugated anti-tubulin β3 (AF488-TUBB3) antibody in PBS (upper panel) and in VS (lower panel). Brightness and contrast were linearly adjusted to show the same display range in both PBS and VS conditions (as indicated by LUT intensity scale bars).

