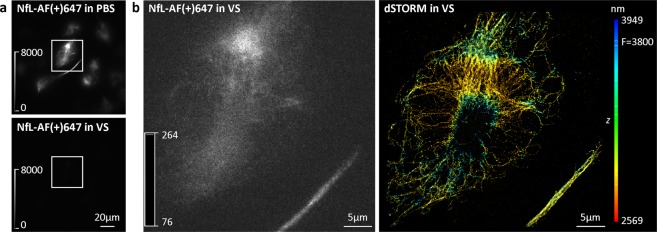
Figure 4.
3D dSTORM super-resolution imaging of neurofilament light chain (NfL) in Vectashield (VS). (a) Widefield images of ND7/23 cells immunolabelled with anti-NfL primary antibody, followed by AF(+)647-conjugated secondary antibody. The same field of view is shown in PBS and in VS. To compare the effect of two different imaging media, look-up table (LUT) intensity scale bars were used. Brightness and contrast were linearly adjusted to show the same display range in both PBS and VS conditions. (b) TIRF image of the boxed regions in panel (a). An image was acquired in VS, with 647 nm laser illumination prior to dSTORM imaging. To ensure the quenched AF(+)647-labelled cell is visible, an auto-scale LUT was used. LUT intensity scale bars show minimum and maximum grey values. The corresponding 3D dSTORM image is shown on the right. The z positions in the 3D dSTORM images are colour-coded according to the height maps shown on right. Height maps contain minimal, maximal and focal (F) z position values.

