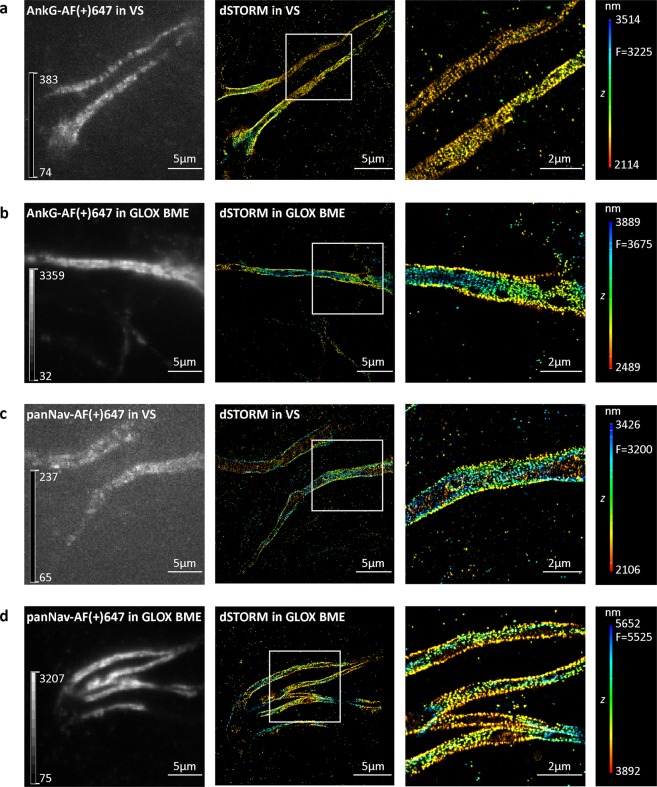
Figure 5.
3D dSTORM super-resolution imaging of axonal initial segments in Vectashield (VS) and GLOX BME. (a,b) Mouse cortical neurons (MCN) labelled with anti-ankyrin G (AnkG) antibody. (c,d) MCN labelled with anti-pan voltage-gated sodium channel (panNav) antibody. Left panels show TIRF images, acquired with 647 nm laser illumination prior to 3D dSTORM imaging. To ensure the quenched AF(+)647 in axonal initial segments in VS is visible, an autoscale look-up table (LUT) was used. LUT intensity scale bars show minimum and maximum grey values. Middle panels show corresponding 3D dSTORM images of AnkG (a,b) and panNav (c,d). Right panels show magnification of the boxed regions shown in the middle panels. Despite the quenching effect of VS, periodic patterns of AnkG and voltage-gated sodium channels can still be resolved. The z positions in the 3D dSTORM images are colour-coded according to the height maps shown on right. Height maps contain minimal, maximal and focal (F) z position values.

