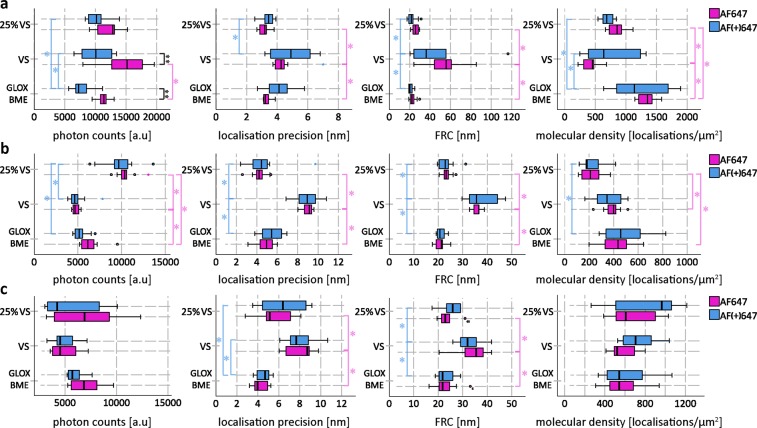
Figure 7.
Quantification of dSTORM parameters of AF647 (magenta) and AF(+)647 (blue) in different imaging media for (a) tubulin β3, (b) βII spectrin and (c) neurofilament light chain (NfL). The box plots show photon counts, lateral localisation precision, FRC and molecular density in GLOX BME, 25% Vectashield (25% VS) and Vectashield (VS). For each of the parameters, 10 images per condition were analysed. Circles indicate outliers. * indicates significance with p < 0.05, obtained by using separate analyses of variance (ANOVAs) with post-hoc Bonferroni comparisons. ** indicates significance with p < 0.004167, obtained using 12 t-tests with Bonferroni corrections. Detailed explanations on statistical analysis can be found in the Supplementary Information.

