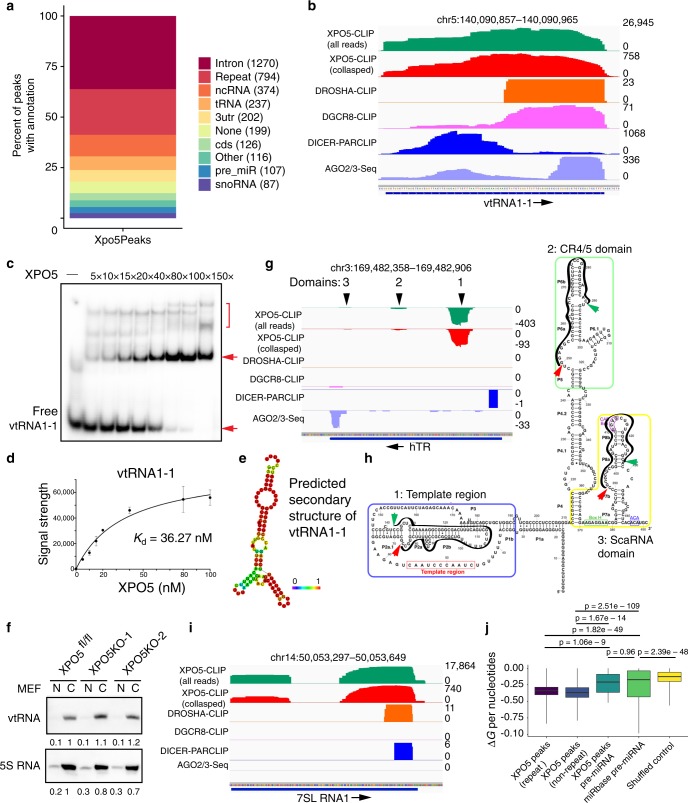
Fig. 5. XPO5 associates with diverse cellular RNAs.
a Peak annotation of XPO5-associated reads from XPO5 HITS-CLIP. b, g, i IGV tracks of vtRNA1-1, hTR, and 7SL RNA1 show the association of XPO5 with each noncoding RNA, compared with DROSHA, DGCR8, DICER1, and AGO2/3. Blue bar at the bottom indicates the coding region and the arrow indicates the direction of transcription. Data range is shown on the right of each track. c XPO5 binds to vtRNA1-1 without RanGTP. 1 nM vtRNA1-1 substrate was used. Red arrows indicate vtRNA1-1 RNA with (upper) and without (lower) XPO5 binding, red bracket indicates the super-shifted vtRNA1-1 RNA with more than one XPO5 molecule. d The dissociation constant (Kd) between XPO5 and vtRNA1-1 is calculated based on the binding results in c. e Predicted secondary structure of vtRNA1-1. The potential to form predicated structures is coloured (purple to red → low to high). f Detection of vtRNA and 5S RNA (loading control) from nuclear and cytoplasmic RNAs extracted from wild type and XPO5 KO MEF cells by northern blotting. h XPO5 HITS-CLIP reads align to the secondary structure of hTR. Red and green arrows indicate the 5′ and 3′ location of XPO5-associated RNA regions, respectively. Black lines outline the XPO5-associated hTR regions. j An RNA Folding analysis shows the folding energy of XPO5-assoicated repeat RNAs, XPO5-assocatied nonrepeat RNAs, XPO5-associated pre-miRNAs, miRbase pre-miRNAs, and randomly shuttled control sequences. For each boxplot, the middle line is the median, the vertical line spans the data range, and the hinges are the first and third quartiles. A two-sided Mann–Whitney test was used for statistical tests. Original data for c and f are provided in the Source Data file.

